Building Your Own Environmental Insights: A Deep Dive into the Anavi Sensor Dashboard’s Architecture
Author: Shafeeque Olassery Kunnikkal | Category: ANAVI Infrared pHAT, BH1750 Light Sensor, BMP180, HTU21D, IoT, Raspberry Pi | Leave a Comment
In our previous article, we introduced the Anavi Sensor Dashboard, an open-source desktop application built with Python and PyQt5 for comprehensive environmental monitoring. We explored its user-friendly interface, key features like real-time visualization, customizable alerts, and data logging, and outlined the hardware and software prerequisites for getting started.
This article takes you “under the hood” to explore the robust and modular architecture that powers the Anavi Sensor Dashboard. We’ll delve into the core components, design patterns, and technical decisions that make this application both powerful and extensible. For those eager to explore the code, the full repository is available on GitHub.
1. The Core: Data Flow and Management
At the heart of any monitoring system is the efficient acquisition, storage, and retrieval of data. The Anavi Sensor Dashboard employs a well-defined data pipeline to ensure reliability and responsiveness.
- Sensor Data Acquisition (sensors/sensor_reader.py): The SensorReaderThread is a dedicated QThread responsible for continuously fetching sensor readings without freezing the main user interface. This critical component encapsulates the logic for interacting with both real hardware sensors (HTU21D, BMP180, BH1750 via smbus2) and mock sensors. It dynamically switches between real and mock modes based on user settings (config.ini) or if real sensor initialization fails, ensuring the application remains operational. Robust error handling is integrated to manage I2C communication issues and sensor read failures gracefully.
- Historical Data Storage (data_management/data_store.py): The SensorDataStore efficiently manages the historical stream of sensor data. It utilizes a collections.deque (double-ended queue) to store a rolling window of recent sensor snapshots, optimizing memory usage while providing quick access to historical data points. This class is also responsible for filtering data based on specified time ranges (e.g., “Last 10 minutes”, “All Data”), which is crucial for dynamic plotting.
- Persistent Data Logging (data_management/logger.py): For long-term data archival, the SensorLogger provides persistent, structured logging to CSV files. It features intelligent management of log files, including daily rotation and configurable maximum file sizes and rotation counts. This prevents log files from consuming excessive disk space and ensures that historical data is always available for external analysis.
2. The Visual Layer: PyQt5 UI and Custom Widgets
The dashboard’s intuitive and highly customizable user interface is built using PyQt5, leveraging its powerful widget system and custom painting capabilities.
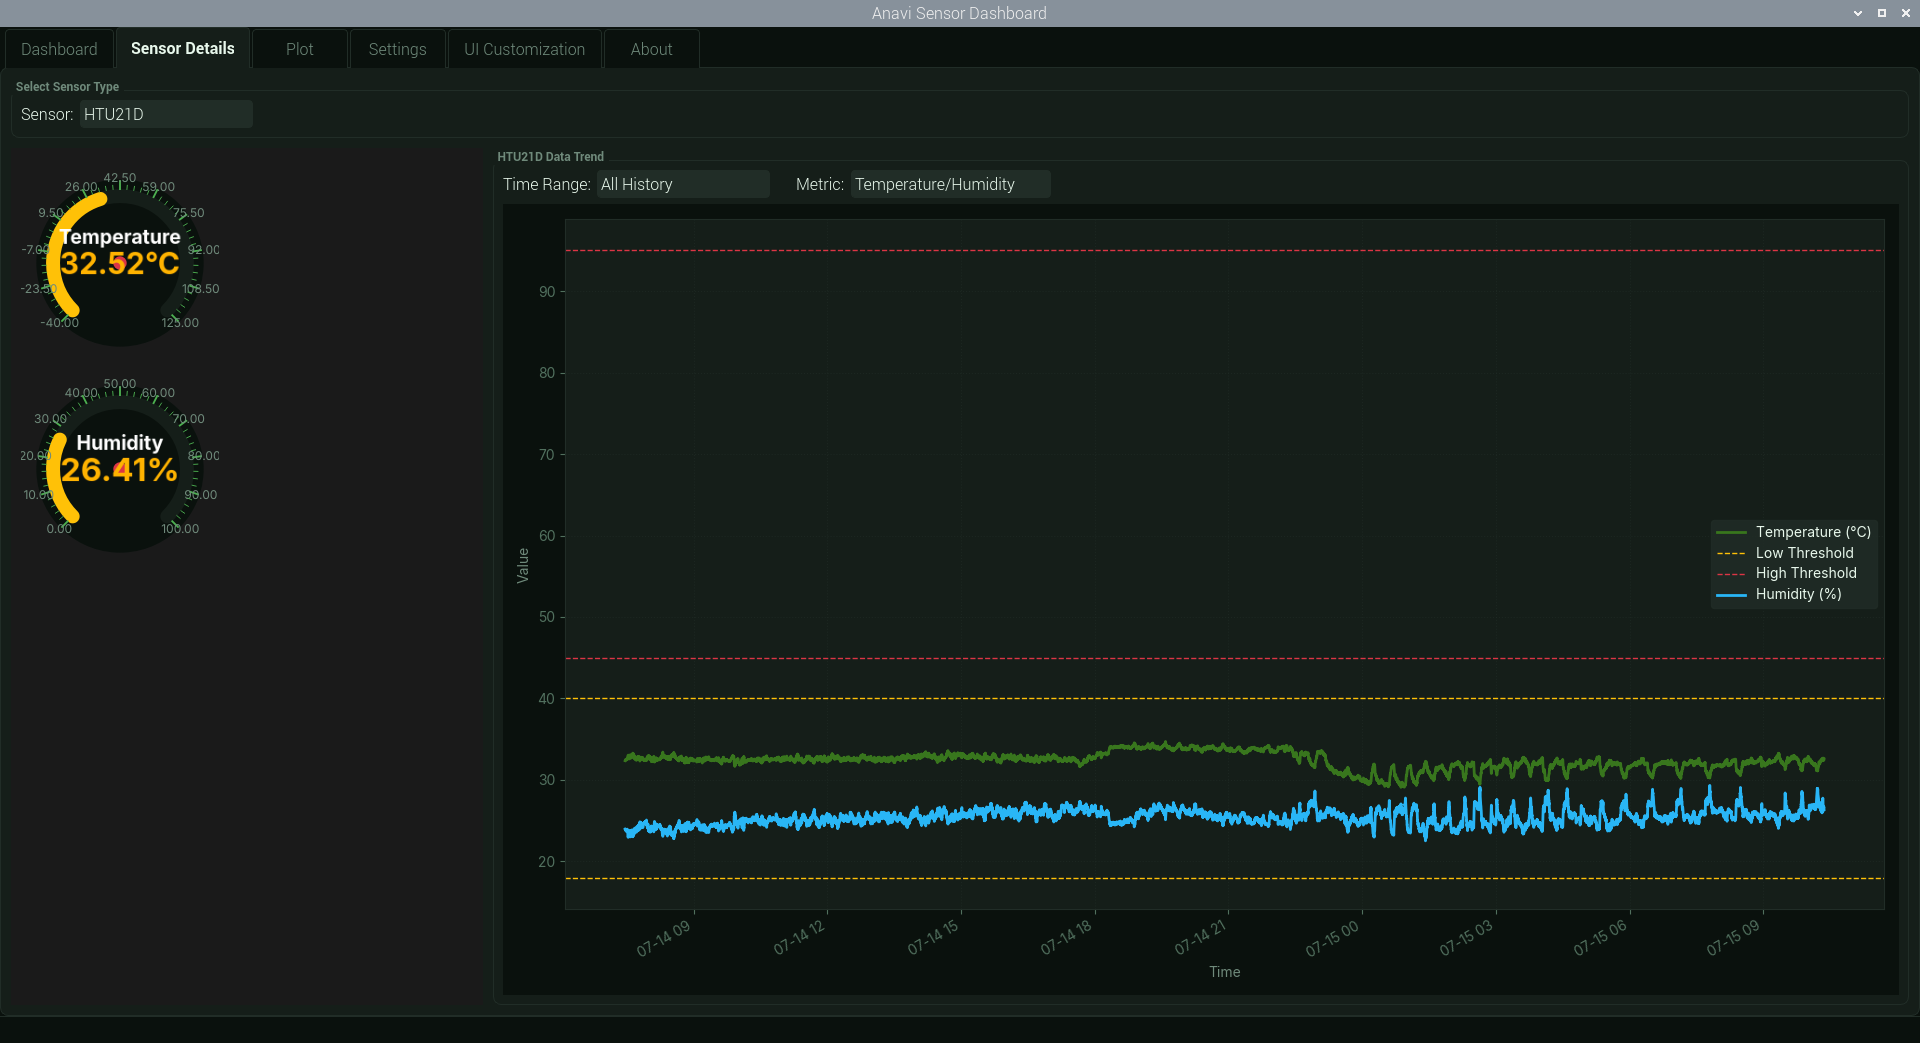
- Application Structure (main.py, ui.py): The MainWindow (main.py) serves as the application’s entry point and central orchestrator. It initializes all core services (settings, data store, sensor reader, logger) and sets up the main UI. The AnaviSensorUI (ui.py) is a QTabWidget that manages the various application tabs (Dashboard, Sensor Details, Plot, Settings, About), acting as a central hub for propagating data updates, theme changes, and UI customization preferences across different views.
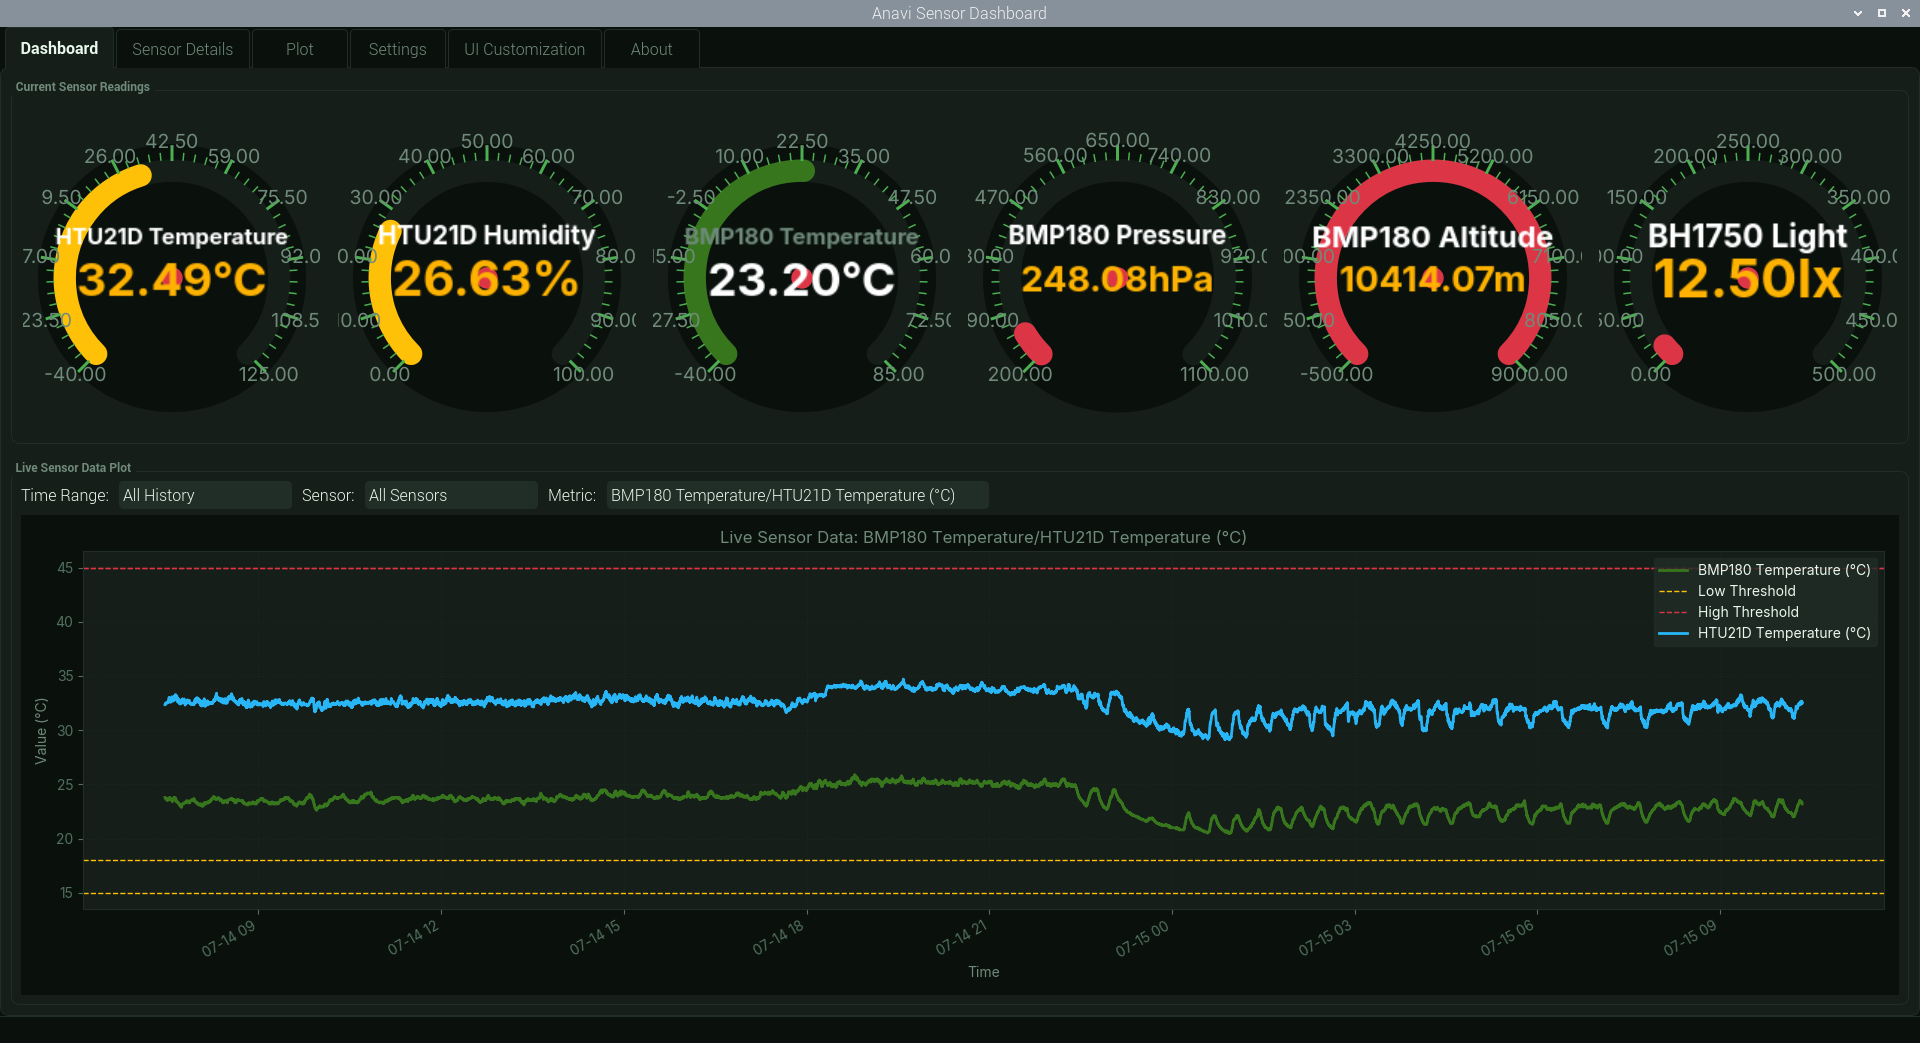
- The Customizable Gauge System (widgets/sensor_display.py and widgets/gauges/): One of the most impressive aspects of the dashboard is its highly flexible gauge display system. The SensorDisplayWidget (widgets/sensor_display.py) is a versatile custom QGroupBox designed to render individual sensor metrics. Its core strength lies in its decoupled drawing architecture.
Instead of embedding all drawing logic directly, SensorDisplayWidget delegates rendering to a series of specialized “drawer” classes located in the widgets/gauges/ directory. This system is built upon BaseGaugeDrawer (base_gauge_drawer.py), which defines common drawing helpers (e.g., for text rendering, frame styling, and theme color retrieval) and an abstract interface for all gauge types.
Concrete implementations handle the unique visual styles:
- AnalogGaugeDrawer (analog_gauge_drawers.py): Base for traditional circular gauges with needles and scales.
- CompactGaugeDrawer (compact_gauge_drawer.py): For horizontal bar-like displays.
- DigitalGaugeDrawer (digital_gauge_drawers.py): For classic digital readouts.
- LinearGaugeDrawer (linear_gauge_drawer.py): For simple vertical or horizontal bar gauges.
- SemiCircleGaugeDrawer (semi_circle_gauge_drawer.py): For semi-circular fill gauges.
- RingGaugeDrawer (ring_gauge_drawer.py): For circular ring-fill gauges.
- CombinedArcNeedleGaugeDrawer (combined_arc_needle_gauge_drawer.py): Combines an arc fill with a needle indicator.
- SpeedometerGaugeDrawer and SpeedometerTickedGaugeDrawer (speedometer_gauge_drawer.py, speedometer_ticked_gauge_drawer.py): Specialized for speedometer-like displays with detailed ticks. Notably, SpeedometerTickedGaugeDrawer employs offscreen QPixmap rendering. This advanced technique renders complex gauge elements to an intermediate image before displaying it on the screen, effectively bypassing potential rendering issues with direct QPainter transformations and leading to a smoother, more robust visual experience.
This modular design allows for easy creation of new gauge types and styles without altering core UI logic, significantly enhancing extensibility and maintainability.
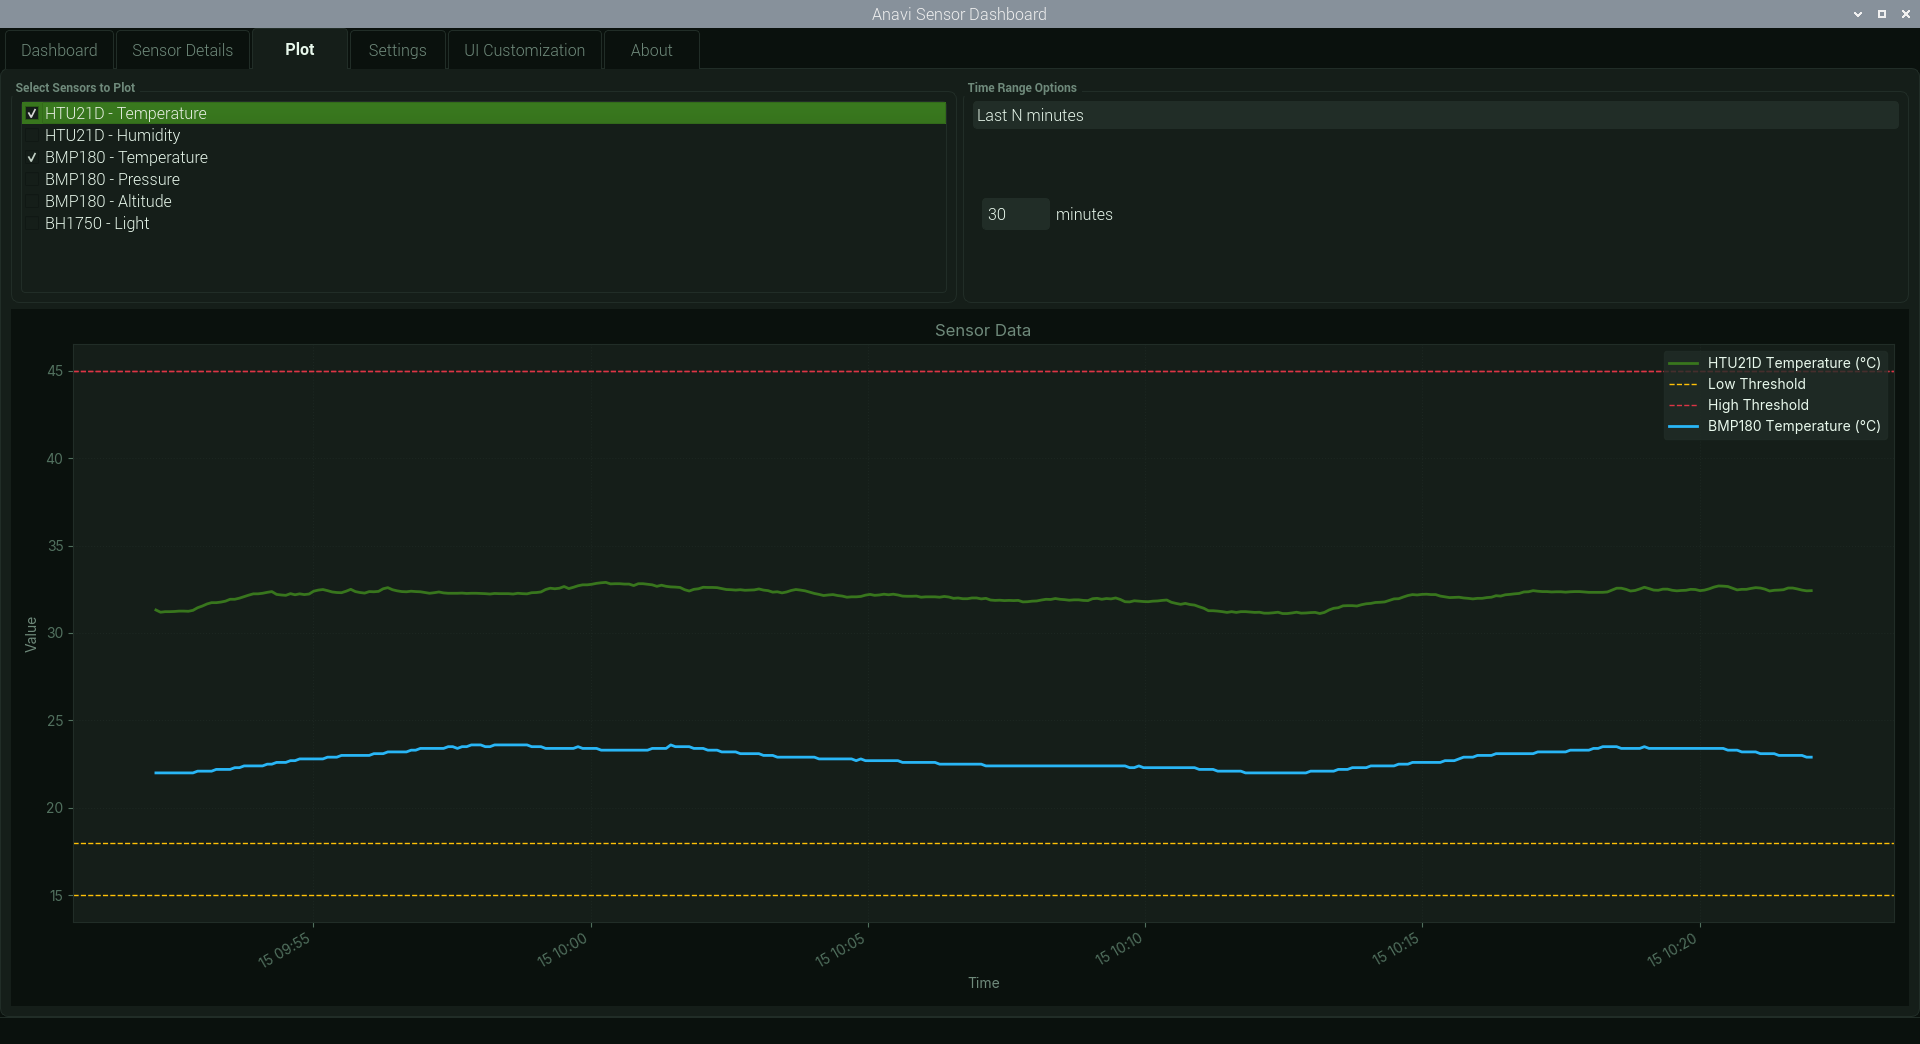
- Flexible Matplotlib Integration (widgets/matplotlib_widget.py): Data visualization is further enhanced by the MatplotlibWidget, a custom PyQt5 widget that seamlessly embeds Matplotlib figures. This reusable component is utilized across various tabs for plotting historical data. It supports dynamic theming to match the application’s aesthetic and provides interactive legends, allowing users to toggle the visibility of individual data series directly on the plot.
3. Configuration and Theming: Dynamic Customization
The dashboard’s high degree of customization is driven by a sophisticated configuration and theming system.
- Centralized Settings Management (data_management/settings.py): The SettingsManager class is the single source of truth for all application configurations, read from and written to config.ini. It handles default values, type conversions (e.g., string to boolean, int, float), and persistence across sessions. It also emits signals when settings are updated, allowing other parts of the application to react dynamically.
- Dynamic QSS Theming (data_management/qss_parser.py): The application’s dynamic theming capabilities go beyond standard PyQt styling. The QSSParser intelligently extracts custom color variables and properties directly from standard QSS (Qt Style Sheet) files. This allows themes to define not just the appearance of standard widgets (like buttons and labels) but also internal drawing colors for custom gauges and Matplotlib plots. This parsed information is then managed by SettingsManager and propagated throughout the UI via AnaviSensorUI, ensuring that every visual element, from button backgrounds to plot lines, adheres to the selected theme seamlessly.
Configuration for Optimal Experience
The Anavi Sensor Dashboard is designed with sensible default values in its config.ini file, providing a robust and convenient starting point for most users and common scenarios. These ‘optimal’ defaults aim to minimize the need for immediate changes, allowing you to get up and running quickly.
- Sensor Ranges ([Sensor_Ranges] section): The _min_value and _max_value for each sensor are carefully chosen to accurately reflect their typical operating ranges, ensuring data is visualized appropriately.
- HTU21D Temperature: -40.0 to 125.0 °C. This broad range adequately covers typical environmental temperature variations for a combined humidity/temperature sensor.
- HTU21D Humidity: 0.0 to 100.0 %. This is the standard operational range for humidity sensors, representing absolute minimum to maximum saturation.
- BMP180 Temperature: -40.0 to 85.0 °C. A common and appropriate range for this barometric pressure and temperature sensor.
- BMP180 Pressure: 200.0 to 1100.0 hPa. This range covers significant atmospheric pressure variations, accommodating diverse weather conditions or altitudes. While 1013 hPa is standard sea-level pressure, this range is optimal if you intend for such values to be represented as a higher point on the gauge. Users desiring a smaller, more granular range for specific pressure monitoring can easily adjust this value.
- BMP180 Altitude: -500.0 to 9000.0 m. This very broad range is optimal for general altitude monitoring, covering scenarios from below sea level to significant heights.
- BH1750 Light: 0.0 to 500.0 lx. This range is suitable for typical indoor lighting conditions. For brighter outdoor environments, users might consider extending the maximum value to better represent higher lux levels.
- Thresholds ([Thresholds] section): Warning and critical thresholds are set at sensible points within the sensor ranges to alert users effectively without being overly sensitive or too late. For instance, the HTU21D temperature has a warning range of 18.0-28.0°C and critical limits at 0.0°C (low) and 45.0°C (high), defining a robust operational window. Similar sensible defaults are applied across all other sensors, including humidity, pressure, altitude, and light, ensuring comprehensive monitoring out-of-the-box.
- UI Settings ([UI] section):
- gauge_type = Combined Arc & Needle: This default provides a modern and comprehensive visual representation, combining an active arc with a traditional needle indicator.
- gauge_style = Gradient Fill: A visually appealing default that adds depth and smoothness to the gauge displays.
- hide_matplotlib_toolbar = true: Ensures a clean, uncluttered interface for the embedded plots by default.
- General Settings ([General] section):
- mock_mode = False: A practical default for production use, requiring actual sensor hardware.
- sampling_rate_ms = 5000: A reasonable 5-second sampling rate balances real-time responsiveness with system resource usage for typical environmental monitoring.
- alert_sound_enabled = False: Disabled by default to avoid jarring new users; can be easily enabled via the settings for audible notifications.
- data_log_enabled = True: Enabled by default for automatic data collection, ensuring historical records are kept without user intervention.
- data_log_max_size_mb = 5.0 and data_log_max_rotations = 5: These values ensure efficient log file management, preventing excessive disk space usage while retaining sufficient historical log data.
- data_store_max_points = 100000: Allows storage of a large volume of historical data points for detailed long-term analysis within the application.
- Overall Assessment: Overall, the config.ini is thoughtfully structured, providing a balanced and functional set of default values for all parameters. This meticulous configuration enhances the user experience by offering a ready-to-use solution that is intuitive and performant.
4. Key Design Principles
The Anavi Sensor Dashboard embodies several key software design principles:
- Modularity and Extensibility: The clear separation of concerns (sensor interaction, data storage, UI presentation, configuration) and the plugin-like gauge drawing system make it easy to add new sensors, gauge types, or features without impacting existing code.
- Separation of Concerns: Each major component (e.g., SensorReaderThread, SensorDataStore, SensorDisplayWidget) has a single, well-defined responsibility, leading to cleaner, more maintainable code.
- Responsiveness: The use of QThread for sensor reading ensures that the UI remains fluid and responsive, providing a smooth user experience even during intensive data acquisition.
- Robustness and Error Handling: Graceful error handling in sensor communication, data parsing, and logging ensures application stability and provides informative feedback to the user.
5. User Interface (UI Preview): A Visual Tour
Conclusion
The Anavi Sensor Dashboard is more than just an environmental monitor; it’s a testament to thoughtful software engineering using Python and PyQt5. Its modular architecture, dynamic customization capabilities, and robust data handling make it an excellent foundation for anyone looking to build or expand their own IoT monitoring solutions.
We encourage you to explore the codebase, experiment with its features, and contribute to its ongoing development. Your insights and contributions can help shape the future of this open-source project.
Contribution and License
The initial framework for the Anavi Sensor Dashboard was generated by Gemini and subsequently refined and enhanced by gr4ytips. This project is open-source and licensed under the Creative Commons Attribution 4.0 International (CC BY 4.0) License. We encourage users and developers to explore the codebase, customize it to their needs, and contribute to its ongoing development. Your contributions, whether through bug reports, feature suggestions, or code submissions, are highly valued.
Disclaimer
The Anavi Sensor Dashboard is provided “as is,” without any warranties. Users are responsible for safe hardware wiring and ensuring a stable power supply. Sensor data provided by the application is raw and uncalibrated; for critical applications, professional calibration and validation are recommended.
Explore the code on GitHub: https://github.com/gr4ytips/Anavi