Unveiling the Anavi Sensor Dashboard: Your Open-Source Environmental Monitor
Leave a CommentIntroduction: Bridging the Gap Between Hardware and Insight
In an increasingly connected world, understanding our immediate environment is more important than ever. Whether for home automation, smart agriculture, or simply personal curiosity, real-time data about temperature, humidity, pressure, and light can empower better decisions. Introducing the Anavi Sensor Dashboard – a robust, customizable, and user-friendly desktop application built with Python and PyQt5, designed to bring your Anavi Technology sensor data to life.
This dashboard transforms raw sensor readings into actionable insights, providing real-time visualizations, historical trends, and customizable alerts. It’s not just a monitoring tool; it’s a foundation for a deeper understanding of your surroundings, crafted with flexibility and expandability in mind.
What is the Anavi Sensor Dashboard? A Deep Dive
The Anavi Sensor Dashboard is a desktop application that interfaces with Anavi Technology’s sensor PHATs (Peripheral Hardware Attached on Top) for Raspberry Pi. It provides a rich graphical user interface (GUI) to:
- Real-time Sensor Monitoring: Get instant readings of various parameters like temperature, humidity, atmospheric pressure, and ambient light. It specifically displays live data from connected HTU21D (Temperature, Humidity), BMP180 (Temperature, Pressure), and BH1750 (Light) sensors.
- Visualize Historical Data: Explore trends over time with dynamic plots that can be customized to show data from the last few minutes to “All Data” collected. It offers dedicated plots for each sensor metric, with a global time range control for historical data.
- Set Personalized Alerts: Define high and low thresholds for each sensor metric. The application provides visual and auditory cues when values fall outside your specified safe ranges.
- Customize Your Experience: Choose from multiple gauge types (Standard, Compact, Digital, Analog, Progress Bar) and a wide array of styles (Flat, Shadowed, Raised, Inset, Heavy Border, Clean, Deep Shadow, Outline, Vintage, Subtle, Fresh, Bright, Bold) to tailor the display to your preference. It features full QSS (Qt Style Sheet) theming, including pre-configured Blue and Emerald Forest themes.
- Log Data Reliably: All sensor readings are logged to local files, ensuring you have a persistent record of your environmental data. The logging system supports daily rotation and limits on file size and number of rotations to prevent excessive disk usage.
- Modular Architecture: The application boasts a modular architecture, making it easily expandable with support for new sensors and UI elements.
- Persistent Settings: Your preferences and sensor configurations are automatically saved and restored across application sessions.
Prerequisites: Getting Started with Your Anavi Dashboard
Hardware Requirements
To run the Anavi Sensor Dashboard, you’ll need the following hardware components:
- Raspberry Pi: A Raspberry Pi 4 Model B is recommended for optimal performance, especially with the graphical interface and data processing. Other Raspberry Pi models (e.g., Raspberry Pi 3 Model B+ or newer) may also work.
- MicroSD Card: Minimum 16GB (Class 10 or faster) for the Raspberry Pi’s operating system and data storage.
- Power Supply: A stable 5.1V, 3.0A USB-C power supply (for Raspberry Pi 4).
- Internet Connection: Required for initial setup and software installation.
- ANAVI Infrared pHAT: This board typically includes an onboard BH1750 Light Sensor.
- Optional External Sensors via I2C: The application also supports external sensors like HTU21D (Temperature, Humidity) and BMP180 (Temperature, Pressure) if connected to your Raspberry Pi via the I2C interface.
Software Requirements
The Anavi Sensor Dashboard is built on the Python ecosystem. Here’s what you’ll need to install:
- Python 3: Ensure Python 3 is installed (you can check with
python3 --version). - Pip: Python’s package installer (
sudo apt install python3-pip). - PyQt5: For the graphical user interface (
sudo apt install python3-pyqt5 python3-pyqt5.qtsvg). - Matplotlib: For data plotting (
sudo apt install python3-matplotlib). - NumPy: For numerical operations (
sudo apt install python3-numpy). - smbus2 / I2C tools: For I2C communication with sensors (
sudo apt install i2c-tools python3-smbus). - Pillow: For image processing, if required by certain UI elements or themes (
pip3 install Pillow).
Enabling I2C on your Raspberry Pi: This is crucial for sensor communication. You can enable it via the Raspberry Pi configuration tool:
sudo raspi-config
# Navigate to Interface Options -> I2C -> Select Yes
sudo reboot
Optional: Verify I2C sensors are detected: After rebooting, you can check if your I2C sensors are recognized:
i2cdetect -y 1
Expected sensor addresses: 0x40 (HTU21D), 0x77 (BMP180), 0x23 (BH1750).
Installation Guide: Getting Up and Running
Follow these steps to set up the Anavi Sensor Dashboard on your Raspberry Pi:
Clone the Repository:git clone https://github.com/gr4ytips/Anavi.git
cd InfraredpHAT
Install Python Dependencies: You can install all necessary Python libraries using the requirements.txt file provided in the repository:pip3 install -r requirements.txt(Alternatively, you can install them manually if preferred, as listed in the Software Requirements section).
Ensure I2C is Enabled: If you haven’t already, make sure the I2C interface is enabled on your Raspberry Pi as described in the Hardware Requirements section:
sudo raspi-config # Interface Options -> I2C -> Yes sudo reboot
Running the Application: Usage
Once you have completed the installation and prerequisites, launch the application from the InfraredpHAT directory.
python3 main.py
The application will launch, displaying tabs for the dashboard, sensor details, settings, and more.
Key Functionalities in Detail
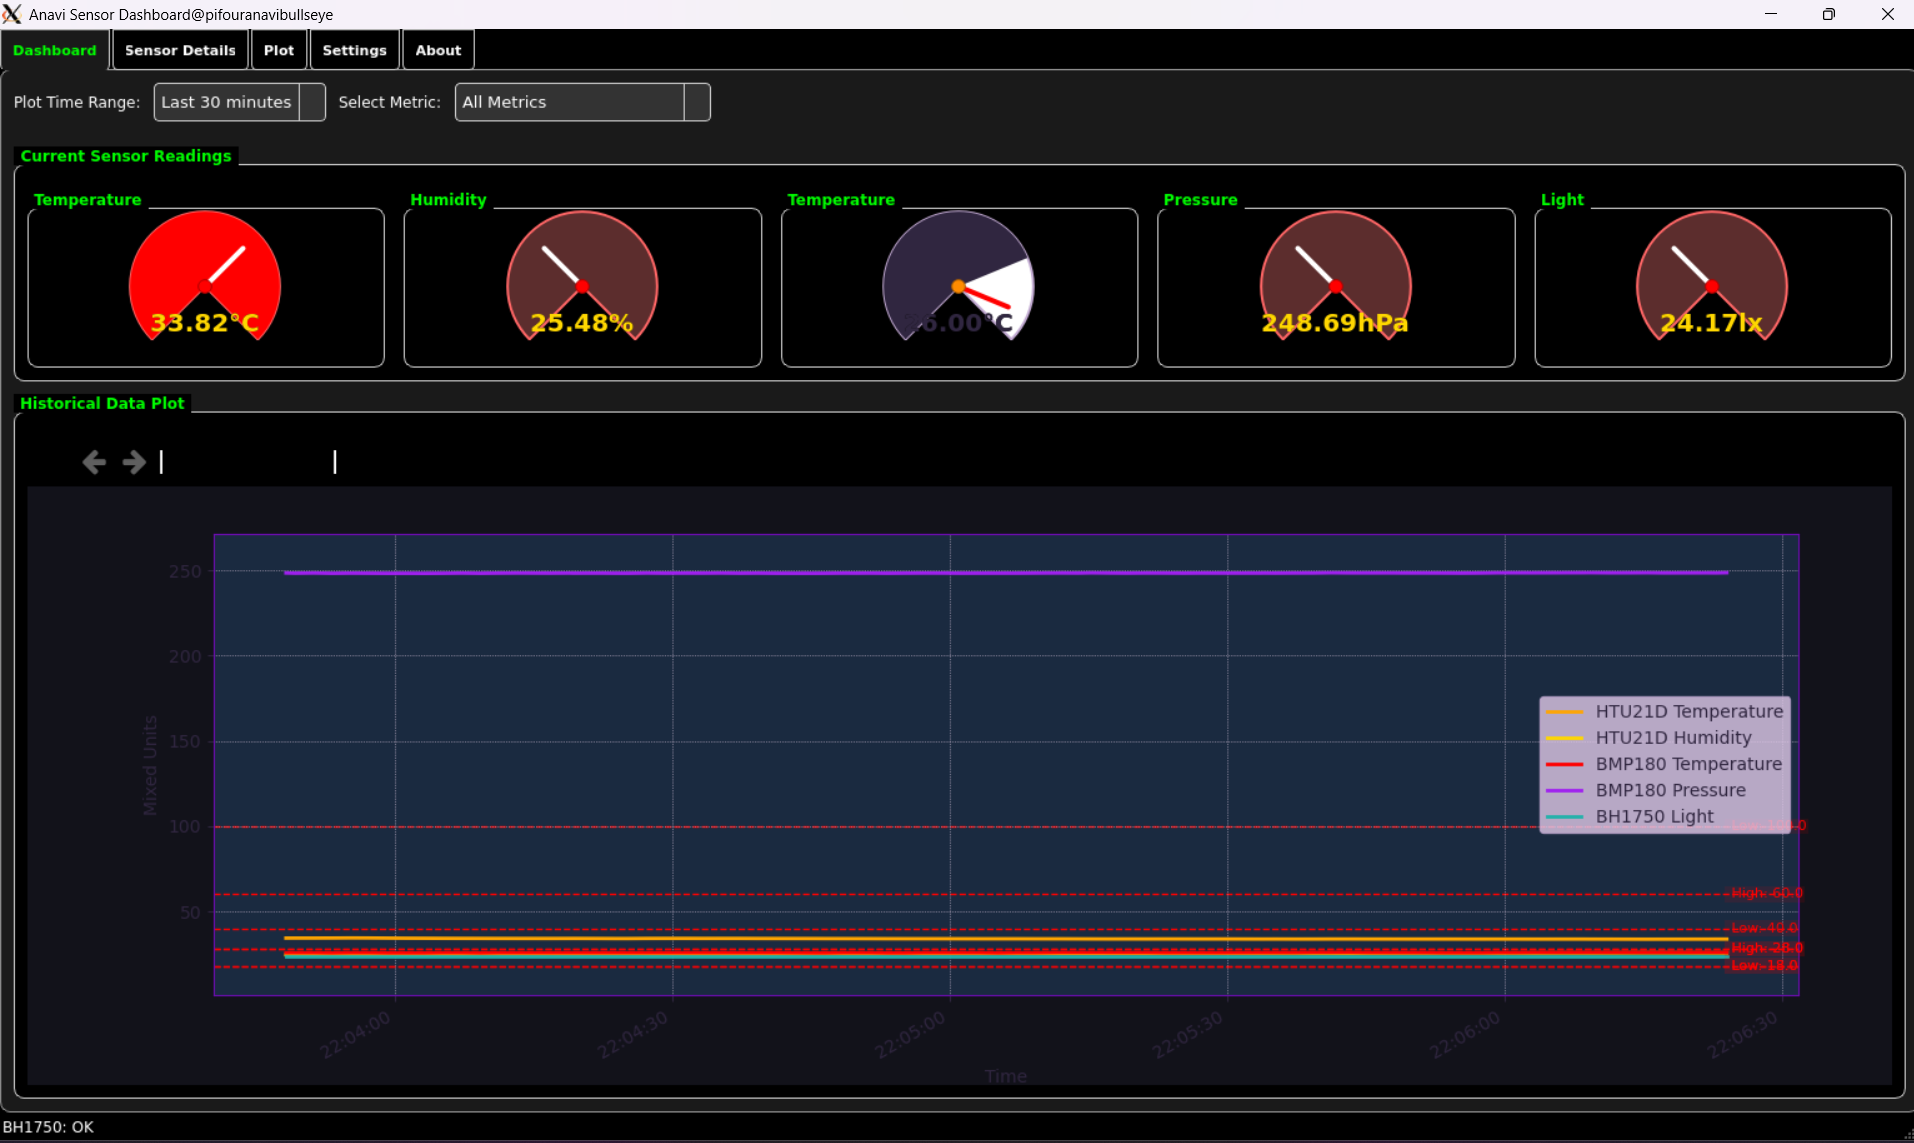
Real-time Monitoring & Dashboard
The Dashboard provides an at-a-glance overview of your environment. Each sensor metric has its own Sensor Display Widget, showing the current value and its unit. A dynamic plot allows you to select which metric to view and over what time range, giving immediate visual feedback on recent changes.
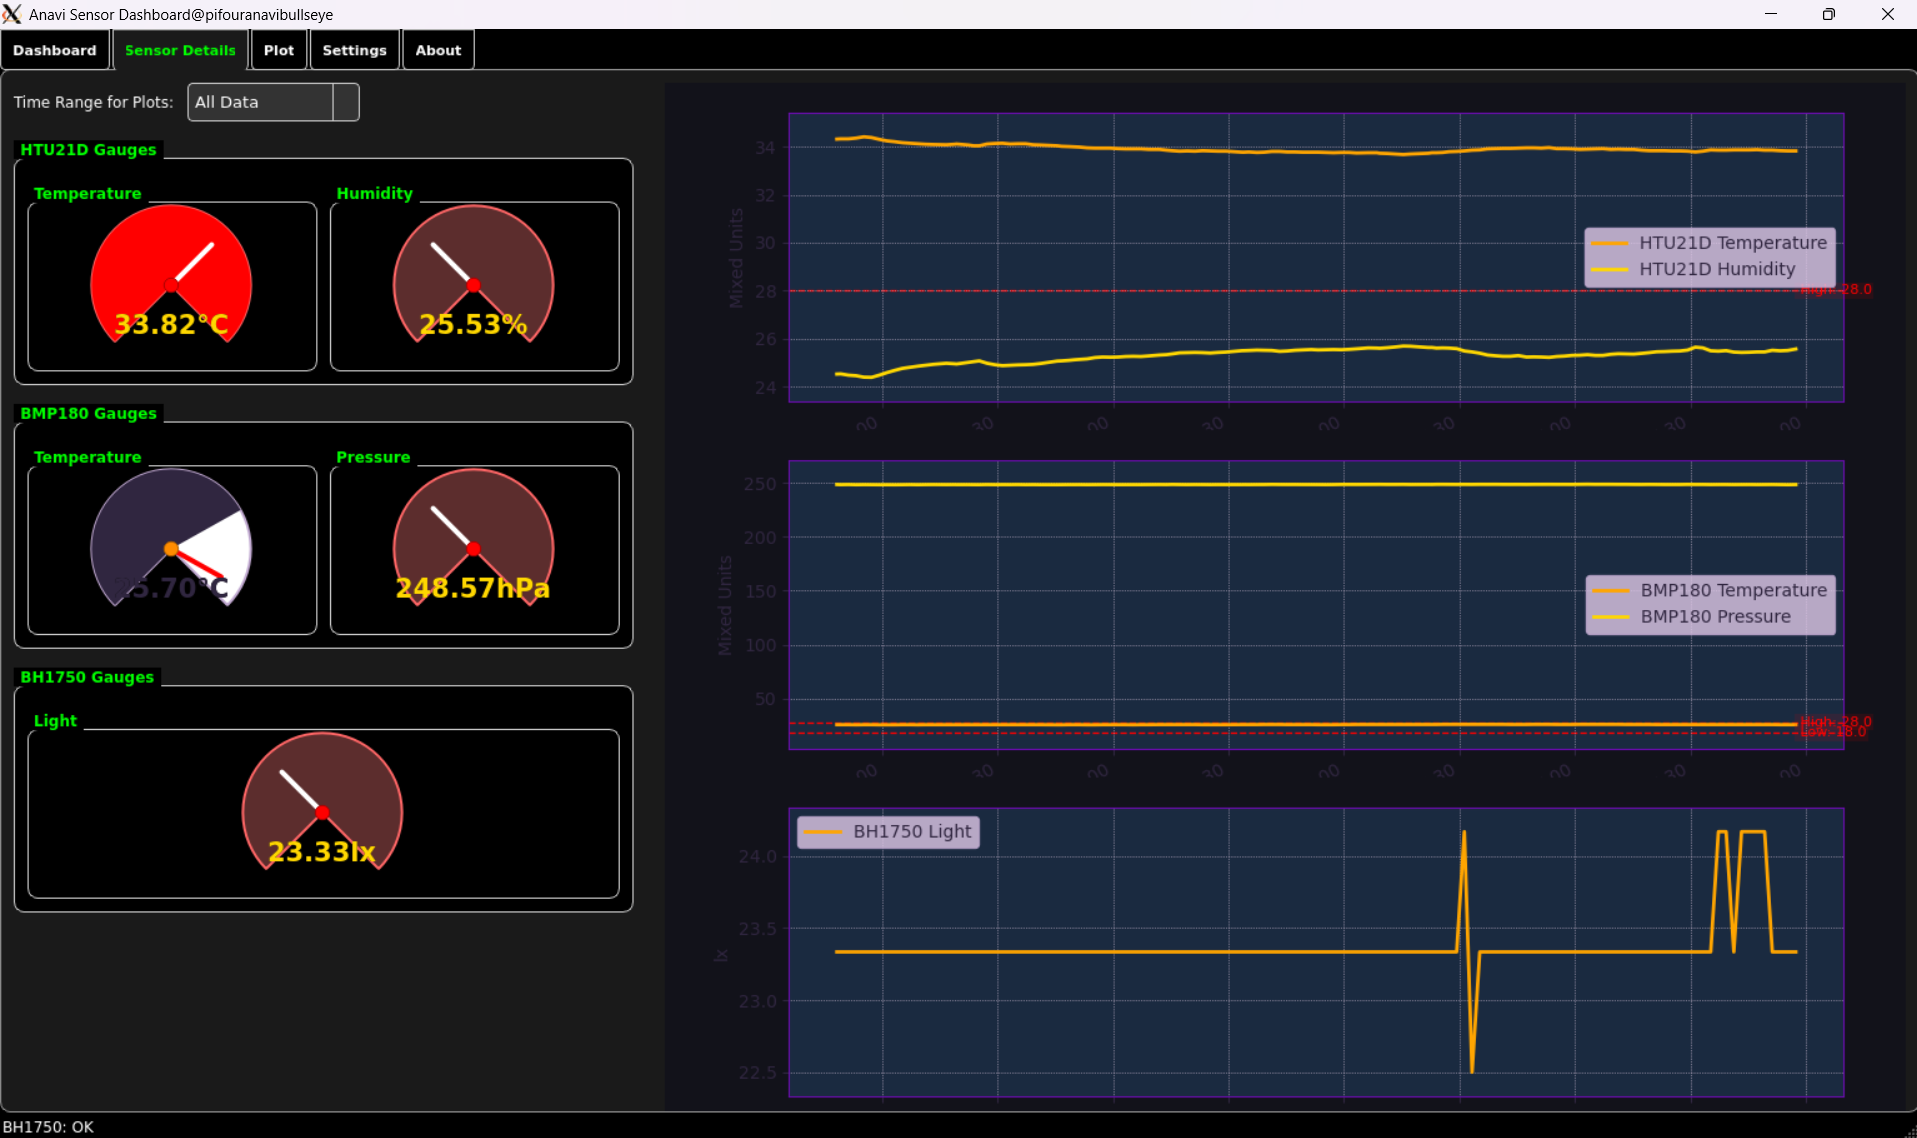
Detailed Sensor Analysis
For a more granular view, the Sensor Details Tab dedicates larger Sensor Display Widget instances to each individual metric. Alongside these, dedicated Matplotlib Widget plots provide historical data for each sensor type (e.g., all HTU21D metrics on one plot, all BMP180 metrics on another). A global time range selector allows you to zoom into specific periods across all detail plots.
Customizable UI: Themes and Gauges
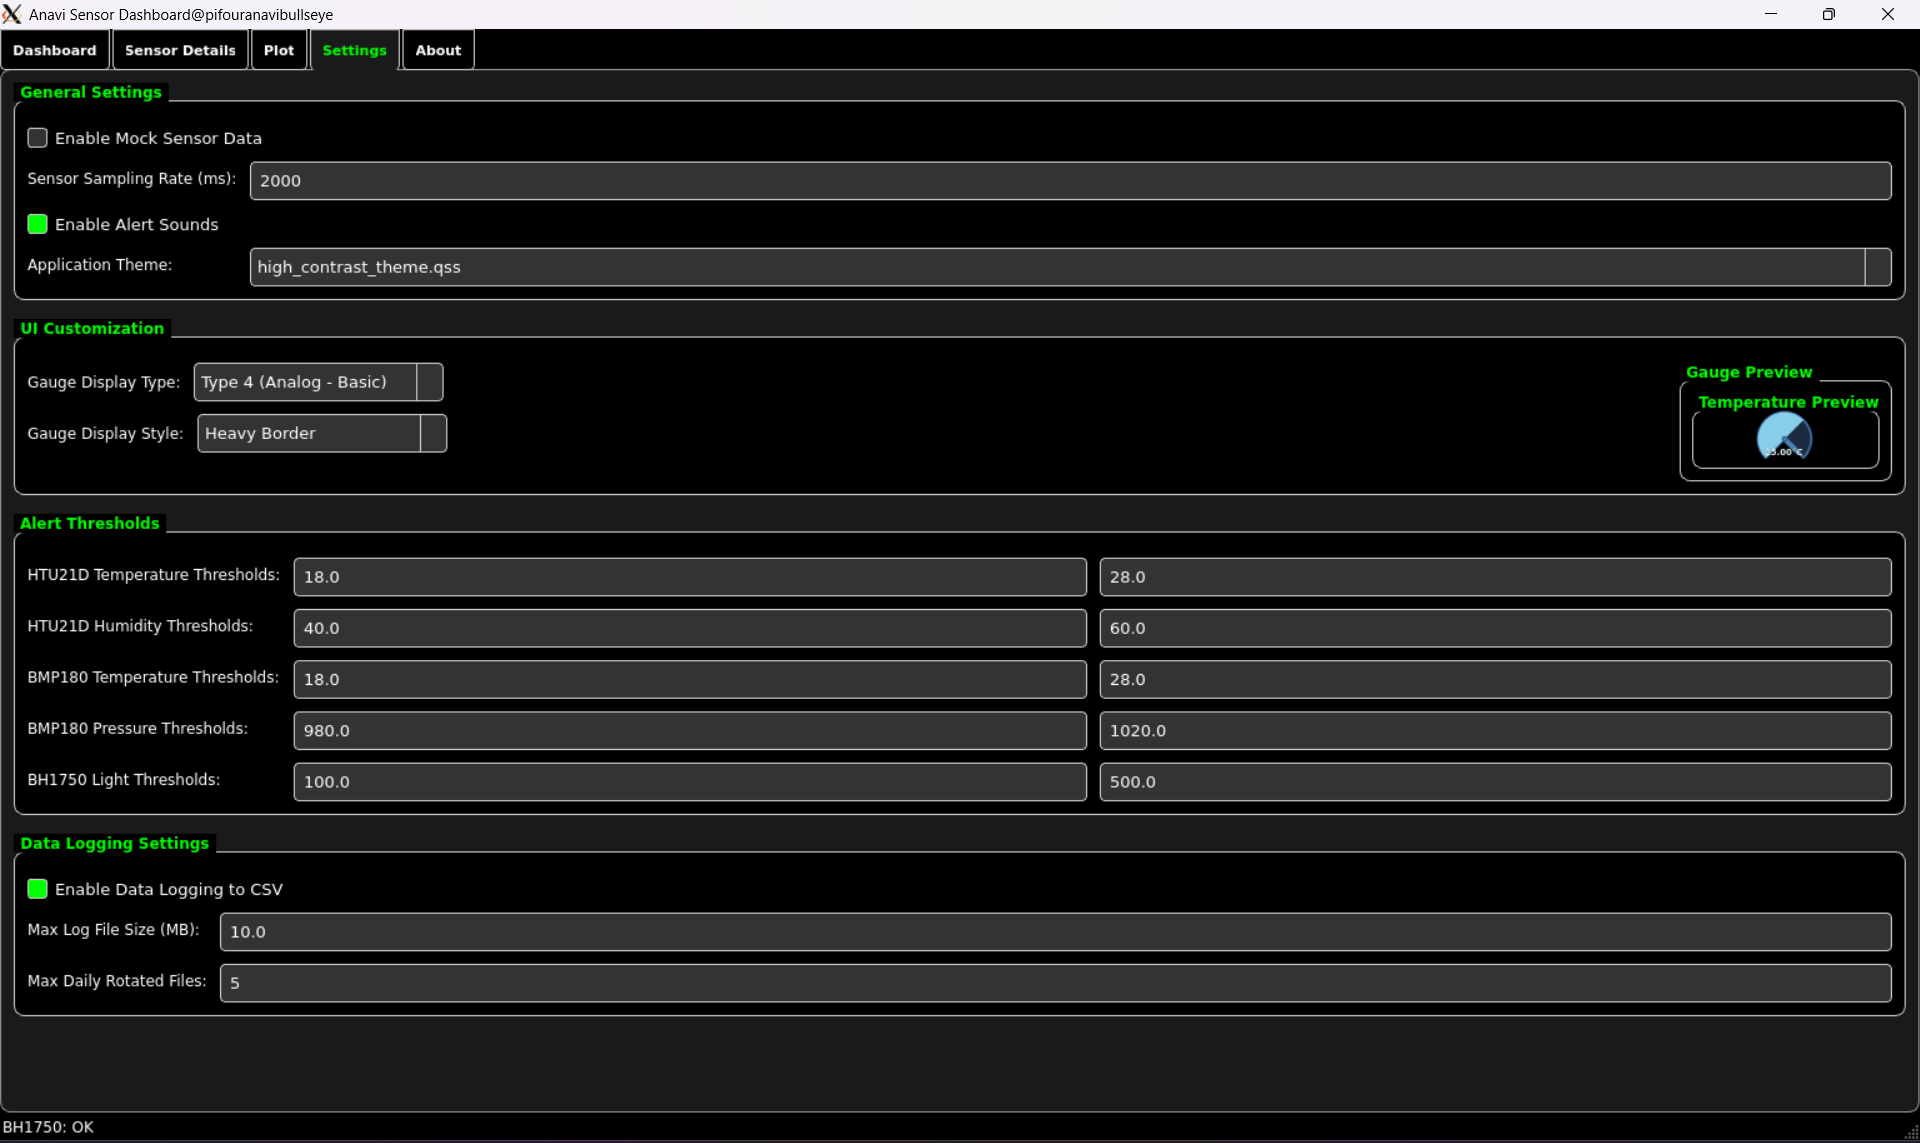
The Settings Tab is where the magic of customization happens.
- Themes: You can switch between various pre-defined themes (like your
blue_theme.qssandemerald_forest_theme.qss, plus the 14 new ones). These themes aren’t just for colors; they define the entire look and feel of the application elements, from buttons and text inputs to scroll bars and tab widgets. - Gauge Types & Styles: For each sensor display, you can choose from a variety of visual representations:
- Standard/Compact: Classic circular or bar gauges.
- Digital: A retro seven-segment display font for values.
- Analog (Basic/Full): Mimicking traditional dial gauges with needles and scales.
- Progress Bar (Horizontal/Vertical): Clear bar graphs. Each gauge type also supports different visual “styles” (e.g., Flat, Shadowed, Inset) for further aesthetic refinement.
Threshold-based Alerts
You can define low and high thresholds for each sensor metric in the Settings. When a sensor reading crosses these thresholds, the corresponding Sensor Display Widget will visually change (e.g., its border might turn red, its fill color might become critical), and an optional auditory alert can be triggered to draw your attention.
Robust Data Logging
All incoming sensor data is timestamped and written to log files in the Sensor_Logs/ directory. The application utilizes a Rotating File Handler to manage log file size, ensuring that logs don’t consume excessive disk space. Old logs are automatically archived or rotated, keeping your system tidy.
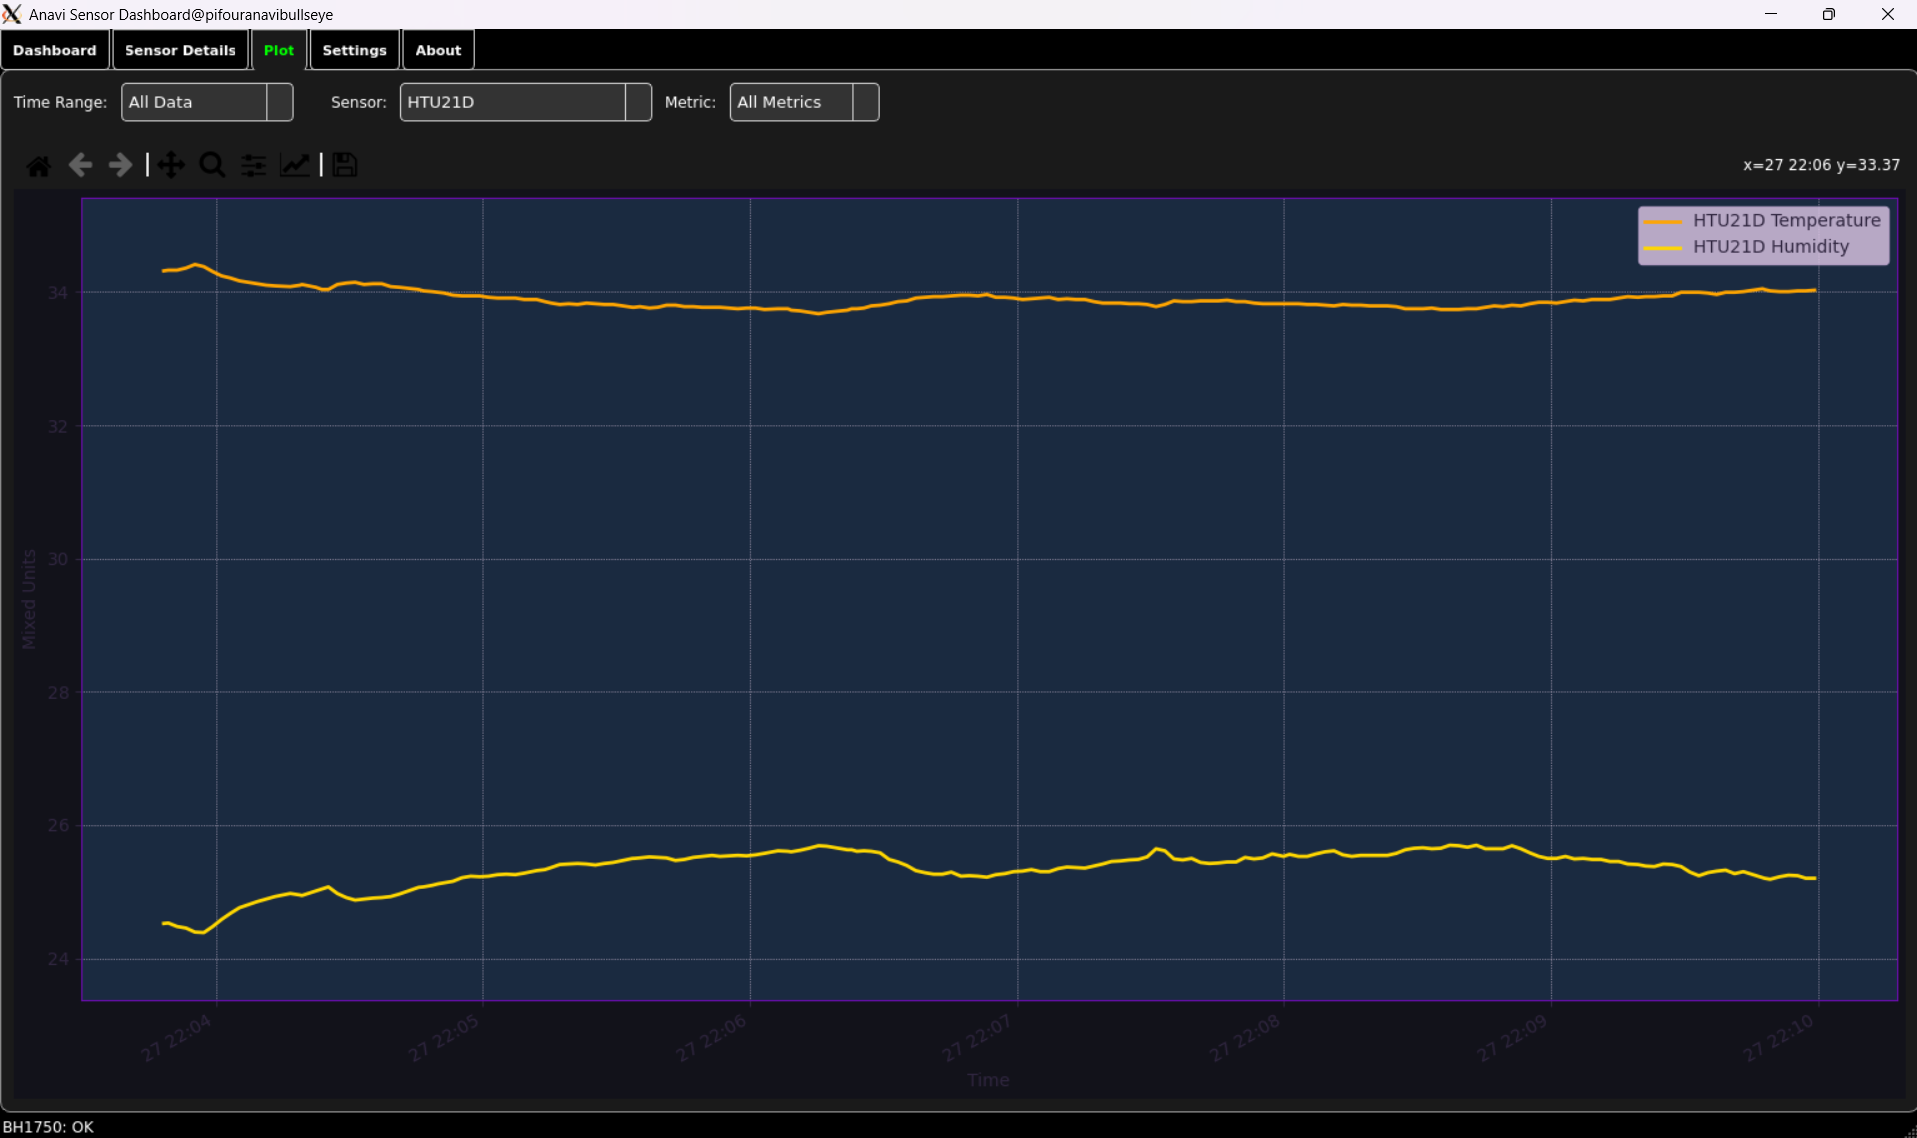
Dynamic Plotting with Matplotlib
The Matplotlib Widget is a custom PyQt5 widget that embeds a Matplotlib graph. It allows for dynamic updating of sensor data plots. You can interact with the plots, view legends (which are toggleable for individual series), and select different time ranges to analyze trends.
Persistent Settings Management
All your preferences – from selected themes and gauge types to alert thresholds and data logging options – are saved to config.ini using config parser. This ensures your customizations persist across application restarts.
User Interface (UI Preview): A Visual Tour
Here, you would typically insert screenshots or GIFs of your application in action. These visual aids will greatly enhance the blog post.
Dashboard View
Sensor Details View
Plot View
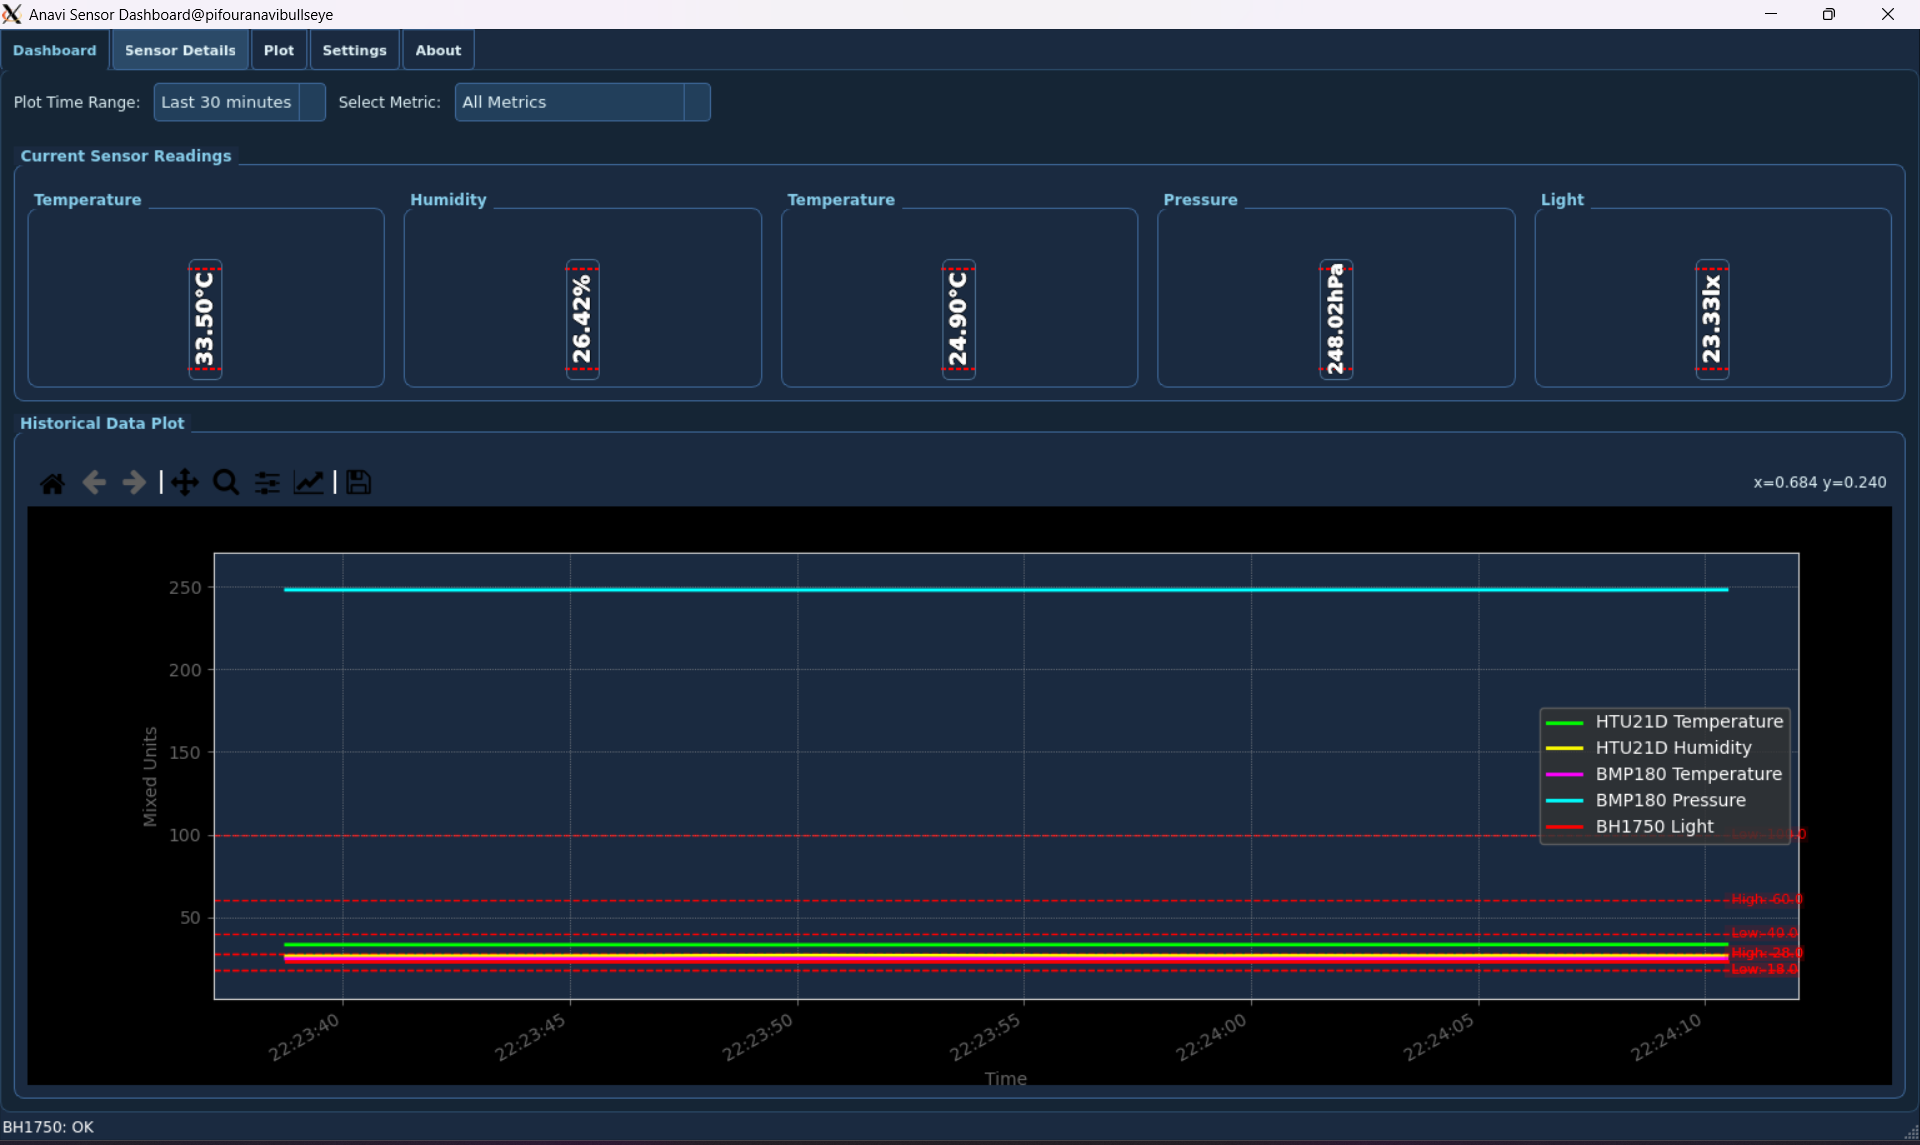
Settings and Configuration Tabs
Credits & Licensing
This application’s initial framework and a significant portion of its core logic were generated by Gemini, a large language model by Google. It has since been meticulously modified, enhanced, and refined by gr4ytips, who has integrated specific Anavi sensor functionalities, implemented advanced UI customizations, and ensured robust data handling.
Creative License
This work is licensed under the Creative Commons Attribution 4.0 International (CC BY 4.0) license.
You are free to:
- Share — copy and redistribute the material in any medium or format
- Adapt — remix, transform, and build upon the material for any purpose, even commercially.
Under the following terms:
- Attribution — You must give appropriate credit, provide a link to the license, and indicate if changes were made.
Liability
This software is provided “as is”, without any warranty—express or implied. Use at your own risk. The authors and contributors shall not be held liable for any claims, damages or other liability, whether in an action of contract, tort or otherwise, arising from, out of or in connection with the software or the use or other dealings in the software.
Warning
- Double-check GPIO/I2C wiring to avoid hardware damage.
- Use a stable power supply.
- Ensure all software dependencies are installed.
- Sensor data is raw and uncalibrated.
- For long-term use, consider backups and watchdogs.
Disclaimer
This application is for monitoring only. Not for use in critical or life-sustaining systems.
What’s Next for the Anavi Sensor Dashboard?
This application is a living project, with potential for future enhancements based on user feedback and new Anavi hardware. Possible future features could include:
- Network/Cloud Integration: Sending data to online platforms for remote monitoring and long-term storage.
- Web Interface: A web-based interface for accessing the dashboard from any device on your local network.
- More Sensor Support: Expanding compatibility to other Anavi PHAT sensors.
- Advanced Data Analysis: Implementing more sophisticated data processing and predictive analytics.
- User Management: For multi-user environments.
Encourage you to explore the code, customize it further, and contribute to its development! Your feedback and contributions are always welcome.
Thank you for exploring the Anavi Sensor Dashboard!