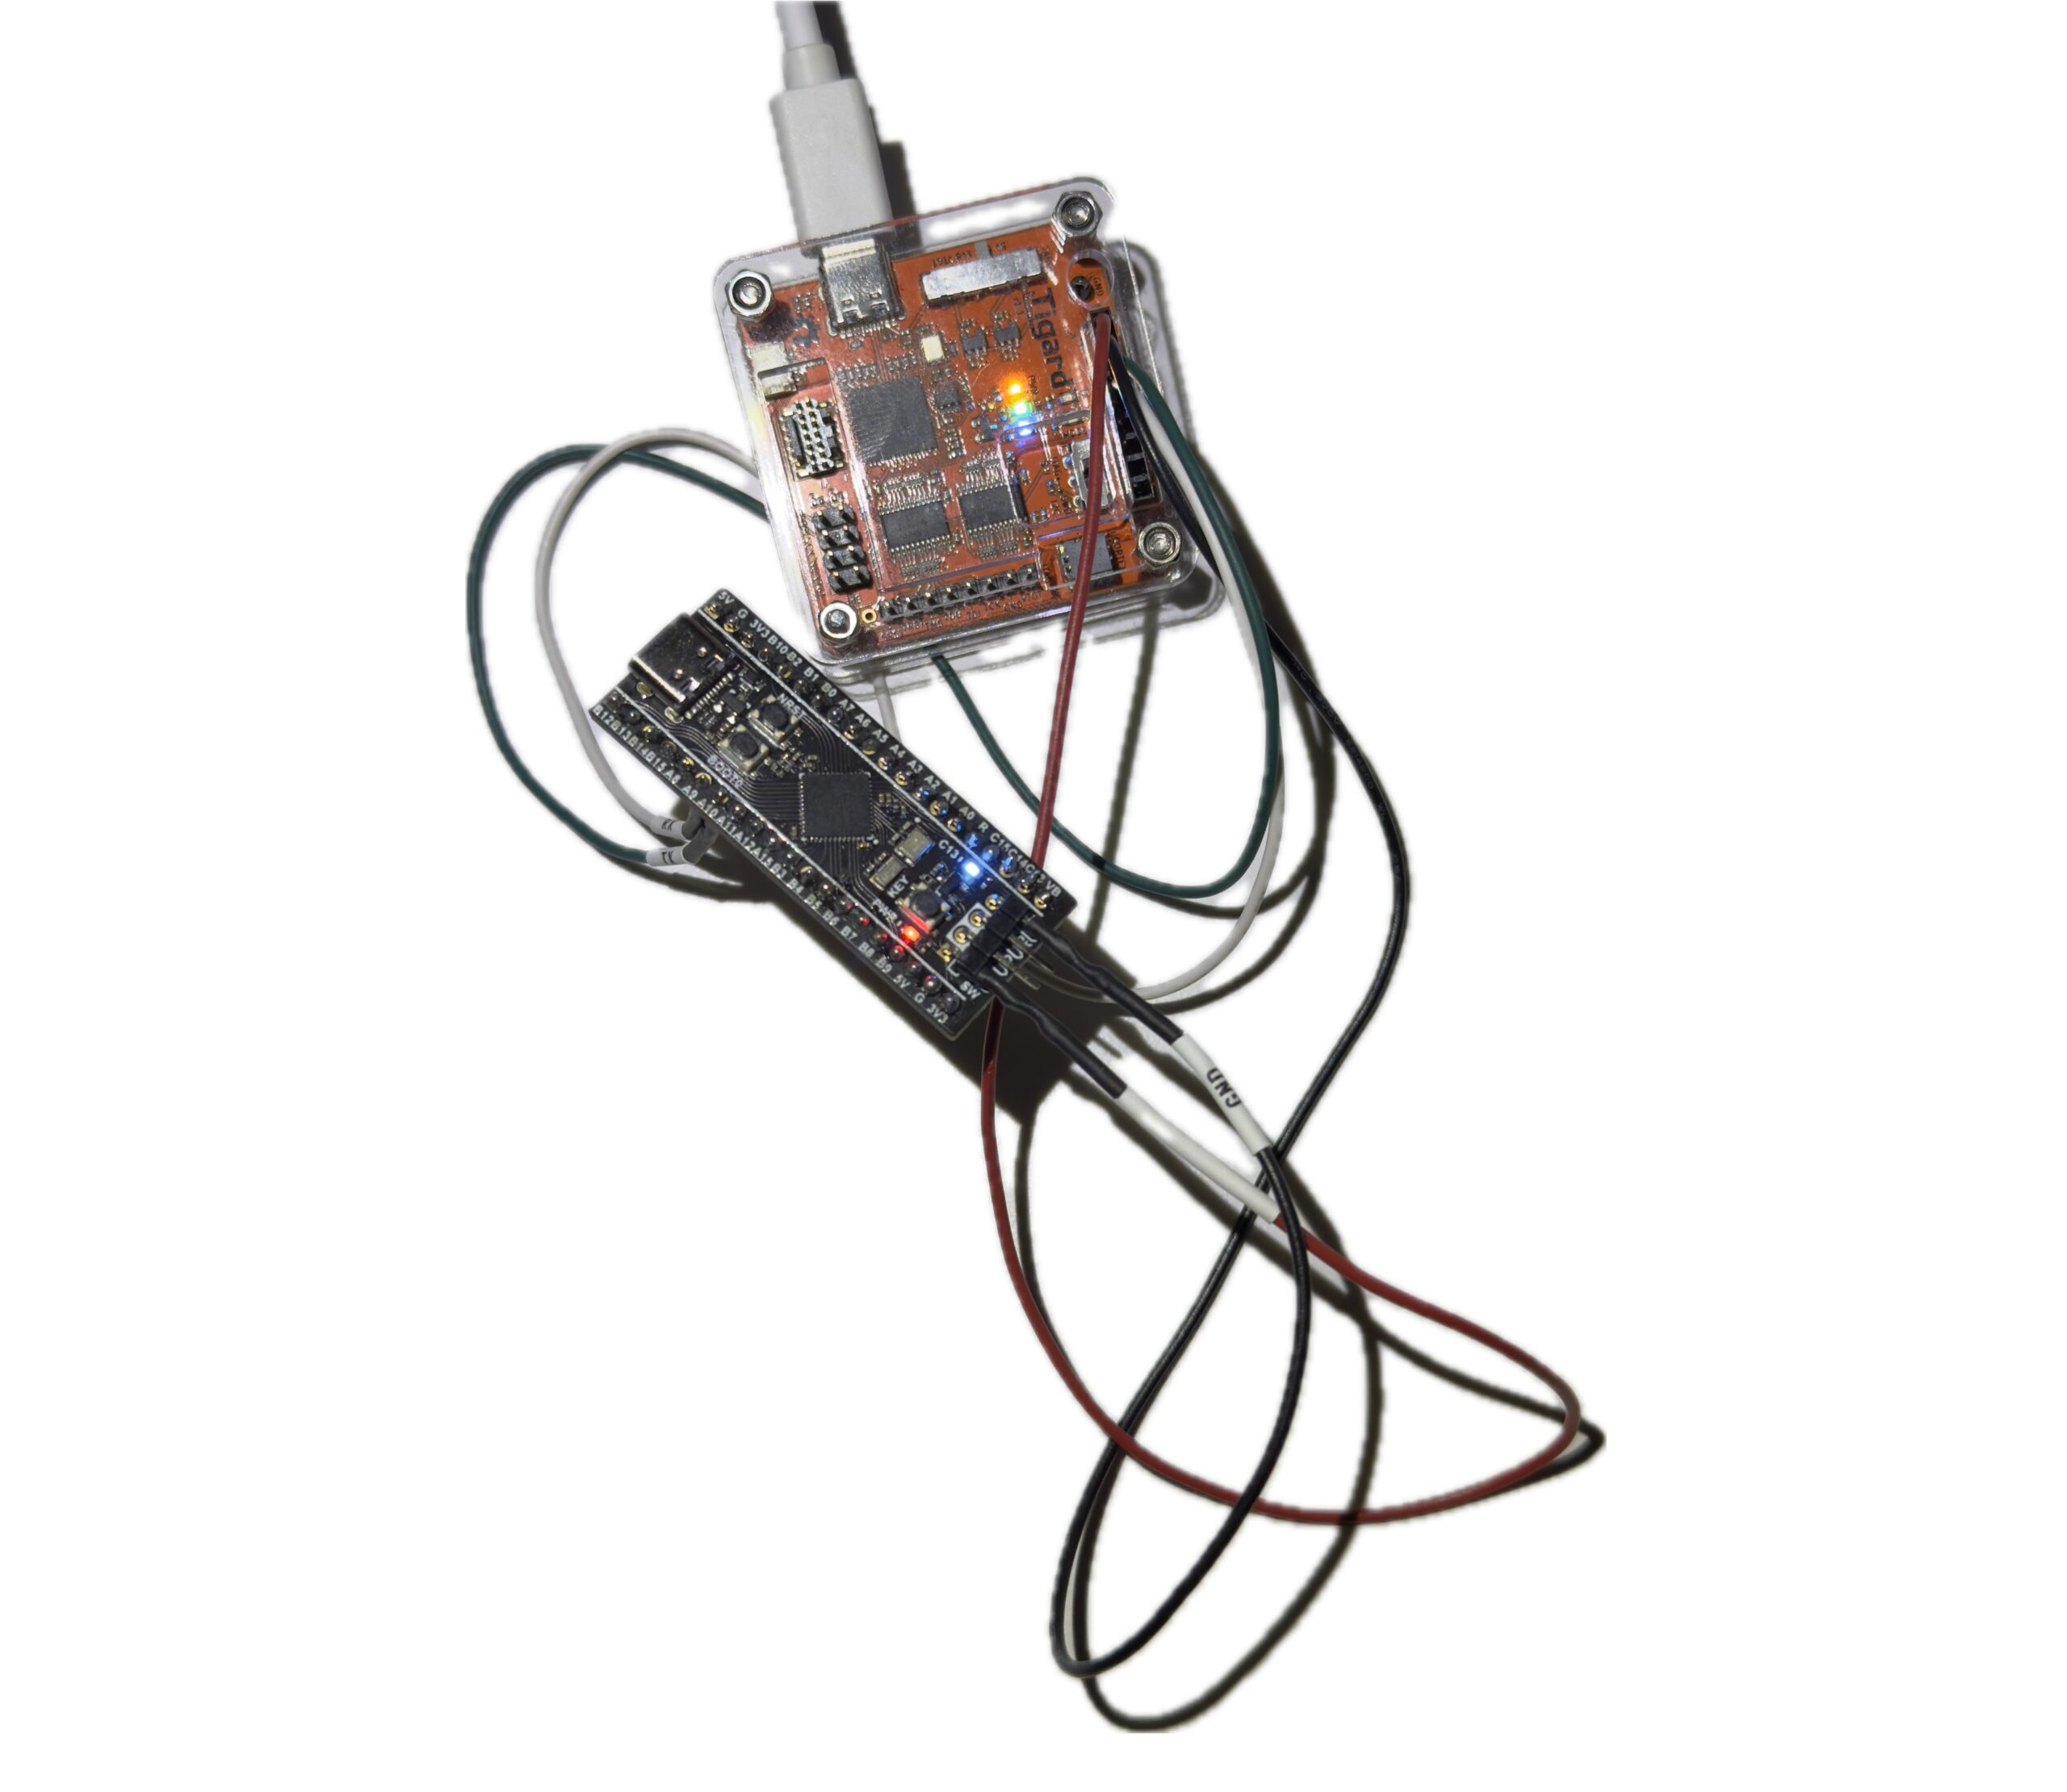
Author Archives: Shafeeque Olassery Kunnikkal

  1. Building Your Own Environmental Insights: A Deep Dive into the Anavi Sensor Dashboard’s Architecture

    Leave a Comment

    In our previous article, we introduced the Anavi Sensor Dashboard, an open-source desktop application built with Python and PyQt5 for comprehensive environmental monitoring. We explored its user-friendly interface, key features like real-time visualization, customizable alerts, and data logging, and outlined the hardware and software prerequisites for getting started.

    This article takes you “under the hood” to explore the robust and modular architecture that powers the Anavi Sensor Dashboard. We’ll delve into the core components, design patterns, and technical decisions that make this application both powerful and extensible. For those eager to explore the code, the full repository is available on GitHub.

    1. The Core: Data Flow and Management

    At the heart of any monitoring system is the efficient acquisition, storage, and retrieval of data. The Anavi Sensor Dashboard employs a well-defined data pipeline to ensure reliability and responsiveness.

    • Sensor Data Acquisition (sensors/sensor_reader.py): The SensorReaderThread is a dedicated QThread responsible for continuously fetching sensor readings without freezing the main user interface. This critical component encapsulates the logic for interacting with both real hardware sensors (HTU21D, BMP180, BH1750 via smbus2) and mock sensors. It dynamically switches between real and mock modes based on user settings (config.ini) or if real sensor initialization fails, ensuring the application remains operational. Robust error handling is integrated to manage I2C communication issues and sensor read failures gracefully.
    • Historical Data Storage (data_management/data_store.py): The SensorDataStore efficiently manages the historical stream of sensor data. It utilizes a collections.deque (double-ended queue) to store a rolling window of recent sensor snapshots, optimizing memory usage while providing quick access to historical data points. This class is also responsible for filtering data based on specified time ranges (e.g., “Last 10 minutes”, “All Data”), which is crucial for dynamic plotting.
    • Persistent Data Logging (data_management/logger.py): For long-term data archival, the SensorLogger provides persistent, structured logging to CSV files. It features intelligent management of log files, including daily rotation and configurable maximum file sizes and rotation counts. This prevents log files from consuming excessive disk space and ensures that historical data is always available for external analysis.

    2. The Visual Layer: PyQt5 UI and Custom Widgets

    The dashboard’s intuitive and highly customizable user interface is built using PyQt5, leveraging its powerful widget system and custom painting capabilities.

    • Application Structure (main.py, ui.py): The MainWindow (main.py) serves as the application’s entry point and central orchestrator. It initializes all core services (settings, data store, sensor reader, logger) and sets up the main UI. The AnaviSensorUI (ui.py) is a QTabWidget that manages the various application tabs (Dashboard, Sensor Details, Plot, Settings, About), acting as a central hub for propagating data updates, theme changes, and UI customization preferences across different views.
    • The Customizable Gauge System (widgets/sensor_display.py and widgets/gauges/): One of the most impressive aspects of the dashboard is its highly flexible gauge display system. The SensorDisplayWidget (widgets/sensor_display.py) is a versatile custom QGroupBox designed to render individual sensor metrics. Its core strength lies in its decoupled drawing architecture.

    Instead of embedding all drawing logic directly, SensorDisplayWidget delegates rendering to a series of specialized “drawer” classes located in the widgets/gauges/ directory. This system is built upon BaseGaugeDrawer (base_gauge_drawer.py), which defines common drawing helpers (e.g., for text rendering, frame styling, and theme color retrieval) and an abstract interface for all gauge types.

    Concrete implementations handle the unique visual styles:

    • AnalogGaugeDrawer (analog_gauge_drawers.py): Base for traditional circular gauges with needles and scales.
    • CompactGaugeDrawer (compact_gauge_drawer.py): For horizontal bar-like displays.
    • DigitalGaugeDrawer (digital_gauge_drawers.py): For classic digital readouts.
    • LinearGaugeDrawer (linear_gauge_drawer.py): For simple vertical or horizontal bar gauges.
    • SemiCircleGaugeDrawer (semi_circle_gauge_drawer.py): For semi-circular fill gauges.
    • RingGaugeDrawer (ring_gauge_drawer.py): For circular ring-fill gauges.
    • CombinedArcNeedleGaugeDrawer (combined_arc_needle_gauge_drawer.py): Combines an arc fill with a needle indicator.
    • SpeedometerGaugeDrawer and SpeedometerTickedGaugeDrawer (speedometer_gauge_drawer.py, speedometer_ticked_gauge_drawer.py): Specialized for speedometer-like displays with detailed ticks. Notably, SpeedometerTickedGaugeDrawer employs offscreen QPixmap rendering. This advanced technique renders complex gauge elements to an intermediate image before displaying it on the screen, effectively bypassing potential rendering issues with direct QPainter transformations and leading to a smoother, more robust visual experience.

    This modular design allows for easy creation of new gauge types and styles without altering core UI logic, significantly enhancing extensibility and maintainability.

    • Flexible Matplotlib Integration (widgets/matplotlib_widget.py): Data visualization is further enhanced by the MatplotlibWidget, a custom PyQt5 widget that seamlessly embeds Matplotlib figures. This reusable component is utilized across various tabs for plotting historical data. It supports dynamic theming to match the application’s aesthetic and provides interactive legends, allowing users to toggle the visibility of individual data series directly on the plot.

    3. Configuration and Theming: Dynamic Customization

    The dashboard’s high degree of customization is driven by a sophisticated configuration and theming system.

    • Centralized Settings Management (data_management/settings.py): The SettingsManager class is the single source of truth for all application configurations, read from and written to config.ini. It handles default values, type conversions (e.g., string to boolean, int, float), and persistence across sessions. It also emits signals when settings are updated, allowing other parts of the application to react dynamically.
    • Dynamic QSS Theming (data_management/qss_parser.py): The application’s dynamic theming capabilities go beyond standard PyQt styling. The QSSParser intelligently extracts custom color variables and properties directly from standard QSS (Qt Style Sheet) files. This allows themes to define not just the appearance of standard widgets (like buttons and labels) but also internal drawing colors for custom gauges and Matplotlib plots. This parsed information is then managed by SettingsManager and propagated throughout the UI via AnaviSensorUI, ensuring that every visual element, from button backgrounds to plot lines, adheres to the selected theme seamlessly.

    Configuration for Optimal Experience

    The Anavi Sensor Dashboard is designed with sensible default values in its config.ini file, providing a robust and convenient starting point for most users and common scenarios. These ‘optimal’ defaults aim to minimize the need for immediate changes, allowing you to get up and running quickly.

    • Sensor Ranges ([Sensor_Ranges] section): The _min_value and _max_value for each sensor are carefully chosen to accurately reflect their typical operating ranges, ensuring data is visualized appropriately.
      • HTU21D Temperature: -40.0 to 125.0 °C. This broad range adequately covers typical environmental temperature variations for a combined humidity/temperature sensor.
      • HTU21D Humidity: 0.0 to 100.0 %. This is the standard operational range for humidity sensors, representing absolute minimum to maximum saturation.
      • BMP180 Temperature: -40.0 to 85.0 °C. A common and appropriate range for this barometric pressure and temperature sensor.
      • BMP180 Pressure: 200.0 to 1100.0 hPa. This range covers significant atmospheric pressure variations, accommodating diverse weather conditions or altitudes. While 1013 hPa is standard sea-level pressure, this range is optimal if you intend for such values to be represented as a higher point on the gauge. Users desiring a smaller, more granular range for specific pressure monitoring can easily adjust this value.
      • BMP180 Altitude: -500.0 to 9000.0 m. This very broad range is optimal for general altitude monitoring, covering scenarios from below sea level to significant heights.
      • BH1750 Light: 0.0 to 500.0 lx. This range is suitable for typical indoor lighting conditions. For brighter outdoor environments, users might consider extending the maximum value to better represent higher lux levels.
    • Thresholds ([Thresholds] section): Warning and critical thresholds are set at sensible points within the sensor ranges to alert users effectively without being overly sensitive or too late. For instance, the HTU21D temperature has a warning range of 18.0-28.0°C and critical limits at 0.0°C (low) and 45.0°C (high), defining a robust operational window. Similar sensible defaults are applied across all other sensors, including humidity, pressure, altitude, and light, ensuring comprehensive monitoring out-of-the-box.
    • UI Settings ([UI] section):
      • gauge_type = Combined Arc & Needle: This default provides a modern and comprehensive visual representation, combining an active arc with a traditional needle indicator.
      • gauge_style = Gradient Fill: A visually appealing default that adds depth and smoothness to the gauge displays.
      • hide_matplotlib_toolbar = true: Ensures a clean, uncluttered interface for the embedded plots by default.
    • General Settings ([General] section):
      • mock_mode = False: A practical default for production use, requiring actual sensor hardware.
      • sampling_rate_ms = 5000: A reasonable 5-second sampling rate balances real-time responsiveness with system resource usage for typical environmental monitoring.
      • alert_sound_enabled = False: Disabled by default to avoid jarring new users; can be easily enabled via the settings for audible notifications.
      • data_log_enabled = True: Enabled by default for automatic data collection, ensuring historical records are kept without user intervention.
      • data_log_max_size_mb = 5.0 and data_log_max_rotations = 5: These values ensure efficient log file management, preventing excessive disk space usage while retaining sufficient historical log data.
      • data_store_max_points = 100000: Allows storage of a large volume of historical data points for detailed long-term analysis within the application.
    • Overall Assessment: Overall, the config.ini is thoughtfully structured, providing a balanced and functional set of default values for all parameters. This meticulous configuration enhances the user experience by offering a ready-to-use solution that is intuitive and performant.

    4. Key Design Principles

    The Anavi Sensor Dashboard embodies several key software design principles:

    • Modularity and Extensibility: The clear separation of concerns (sensor interaction, data storage, UI presentation, configuration) and the plugin-like gauge drawing system make it easy to add new sensors, gauge types, or features without impacting existing code.
    • Separation of Concerns: Each major component (e.g., SensorReaderThread, SensorDataStore, SensorDisplayWidget) has a single, well-defined responsibility, leading to cleaner, more maintainable code.
    • Responsiveness: The use of QThread for sensor reading ensures that the UI remains fluid and responsive, providing a smooth user experience even during intensive data acquisition.
    • Robustness and Error Handling: Graceful error handling in sensor communication, data parsing, and logging ensures application stability and provides informative feedback to the user.

    5. User Interface (UI Preview): A Visual Tour

    Conclusion

    The Anavi Sensor Dashboard is more than just an environmental monitor; it’s a testament to thoughtful software engineering using Python and PyQt5. Its modular architecture, dynamic customization capabilities, and robust data handling make it an excellent foundation for anyone looking to build or expand their own IoT monitoring solutions.

    We encourage you to explore the codebase, experiment with its features, and contribute to its ongoing development. Your insights and contributions can help shape the future of this open-source project.

    Contribution and License

    The initial framework for the Anavi Sensor Dashboard was generated by Gemini and subsequently refined and enhanced by gr4ytips. This project is open-source and licensed under the Creative Commons Attribution 4.0 International (CC BY 4.0) License. We encourage users and developers to explore the codebase, customize it to their needs, and contribute to its ongoing development. Your contributions, whether through bug reports, feature suggestions, or code submissions, are highly valued.

    Disclaimer

    The Anavi Sensor Dashboard is provided “as is,” without any warranties. Users are responsible for safe hardware wiring and ensuring a stable power supply. Sensor data provided by the application is raw and uncalibrated; for critical applications, professional calibration and validation are recommended.

    Explore the code on GitHub: https://github.com/gr4ytips/Anavi

  2. Unveiling the Anavi Sensor Dashboard: Your Open-Source Environmental Monitor

    Leave a Comment

    Introduction: Bridging the Gap Between Hardware and Insight

    In an increasingly connected world, understanding our immediate environment is more important than ever. Whether for home automation, smart agriculture, or simply personal curiosity, real-time data about temperature, humidity, pressure, and light can empower better decisions. Introducing the Anavi Sensor Dashboard – a robust, customizable, and user-friendly desktop application built with Python and PyQt5, designed to bring your Anavi Technology sensor data to life.

    This dashboard transforms raw sensor readings into actionable insights, providing real-time visualizations, historical trends, and customizable alerts. It’s not just a monitoring tool; it’s a foundation for a deeper understanding of your surroundings, crafted with flexibility and expandability in mind.

    What is the Anavi Sensor Dashboard? A Deep Dive

    The Anavi Sensor Dashboard is a desktop application that interfaces with Anavi Technology’s sensor PHATs (Peripheral Hardware Attached on Top) for Raspberry Pi. It provides a rich graphical user interface (GUI) to:

    • Real-time Sensor Monitoring: Get instant readings of various parameters like temperature, humidity, atmospheric pressure, and ambient light. It specifically displays live data from connected HTU21D (Temperature, Humidity), BMP180 (Temperature, Pressure), and BH1750 (Light) sensors.
    • Visualize Historical Data: Explore trends over time with dynamic plots that can be customized to show data from the last few minutes to “All Data” collected. It offers dedicated plots for each sensor metric, with a global time range control for historical data.
    • Set Personalized Alerts: Define high and low thresholds for each sensor metric. The application provides visual and auditory cues when values fall outside your specified safe ranges.
    • Customize Your Experience: Choose from multiple gauge types (Standard, Compact, Digital, Analog, Progress Bar) and a wide array of styles (Flat, Shadowed, Raised, Inset, Heavy Border, Clean, Deep Shadow, Outline, Vintage, Subtle, Fresh, Bright, Bold) to tailor the display to your preference. It features full QSS (Qt Style Sheet) theming, including pre-configured Blue and Emerald Forest themes.
    • Log Data Reliably: All sensor readings are logged to local files, ensuring you have a persistent record of your environmental data. The logging system supports daily rotation and limits on file size and number of rotations to prevent excessive disk usage.
    • Modular Architecture: The application boasts a modular architecture, making it easily expandable with support for new sensors and UI elements.
    • Persistent Settings: Your preferences and sensor configurations are automatically saved and restored across application sessions.

    Prerequisites: Getting Started with Your Anavi Dashboard

    Hardware Requirements

    To run the Anavi Sensor Dashboard, you’ll need the following hardware components:

    • Raspberry Pi: A Raspberry Pi 4 Model B is recommended for optimal performance, especially with the graphical interface and data processing. Other Raspberry Pi models (e.g., Raspberry Pi 3 Model B+ or newer) may also work.
    • MicroSD Card: Minimum 16GB (Class 10 or faster) for the Raspberry Pi’s operating system and data storage.
    • Power Supply: A stable 5.1V, 3.0A USB-C power supply (for Raspberry Pi 4).
    • Internet Connection: Required for initial setup and software installation.
    • ANAVI Infrared pHAT: This board typically includes an onboard BH1750 Light Sensor.
    • Optional External Sensors via I2C: The application also supports external sensors like HTU21D (Temperature, Humidity) and BMP180 (Temperature, Pressure) if connected to your Raspberry Pi via the I2C interface.

    Software Requirements

    The Anavi Sensor Dashboard is built on the Python ecosystem. Here’s what you’ll need to install:

    • Python 3: Ensure Python 3 is installed (you can check with python3 --version).
    • Pip: Python’s package installer (sudo apt install python3-pip).
    • PyQt5: For the graphical user interface (sudo apt install python3-pyqt5 python3-pyqt5.qtsvg).
    • Matplotlib: For data plotting (sudo apt install python3-matplotlib).
    • NumPy: For numerical operations (sudo apt install python3-numpy).
    • smbus2 / I2C tools: For I2C communication with sensors (sudo apt install i2c-tools python3-smbus).
    • Pillow: For image processing, if required by certain UI elements or themes (pip3 install Pillow).

    Enabling I2C on your Raspberry Pi: This is crucial for sensor communication. You can enable it via the Raspberry Pi configuration tool:

    sudo raspi-config
    # Navigate to Interface Options -> I2C -> Select Yes
    sudo reboot
    

    Optional: Verify I2C sensors are detected: After rebooting, you can check if your I2C sensors are recognized:

    i2cdetect -y 1
    

    Expected sensor addresses: 0x40 (HTU21D), 0x77 (BMP180), 0x23 (BH1750).

    Installation Guide: Getting Up and Running

    Follow these steps to set up the Anavi Sensor Dashboard on your Raspberry Pi:

    Clone the Repository:git clone https://github.com/gr4ytips/Anavi.git

    cd InfraredpHAT

    Install Python Dependencies: You can install all necessary Python libraries using the requirements.txt file provided in the repository:pip3 install -r requirements.txt
    (Alternatively, you can install them manually if preferred, as listed in the Software Requirements section).

    Ensure I2C is Enabled: If you haven’t already, make sure the I2C interface is enabled on your Raspberry Pi as described in the Hardware Requirements section:

    sudo raspi-config # Interface Options -> I2C -> Yes sudo reboot

    Running the Application: Usage

    Once you have completed the installation and prerequisites, launch the application from the InfraredpHAT directory.

    python3 main.py
    

    The application will launch, displaying tabs for the dashboard, sensor details, settings, and more.

    Key Functionalities in Detail

    Real-time Monitoring & Dashboard

    The Dashboard provides an at-a-glance overview of your environment. Each sensor metric has its own Sensor Display Widget, showing the current value and its unit. A dynamic plot allows you to select which metric to view and over what time range, giving immediate visual feedback on recent changes.

    Detailed Sensor Analysis

    For a more granular view, the Sensor Details Tab dedicates larger Sensor Display Widget instances to each individual metric. Alongside these, dedicated Matplotlib Widget plots provide historical data for each sensor type (e.g., all HTU21D metrics on one plot, all BMP180 metrics on another). A global time range selector allows you to zoom into specific periods across all detail plots.

    Customizable UI: Themes and Gauges

    The Settings Tab is where the magic of customization happens.

    • Themes: You can switch between various pre-defined themes (like your blue_theme.qss and emerald_forest_theme.qss, plus the 14 new ones). These themes aren’t just for colors; they define the entire look and feel of the application elements, from buttons and text inputs to scroll bars and tab widgets.
    • Gauge Types & Styles: For each sensor display, you can choose from a variety of visual representations:
      • Standard/Compact: Classic circular or bar gauges.
      • Digital: A retro seven-segment display font for values.
      • Analog (Basic/Full): Mimicking traditional dial gauges with needles and scales.
      • Progress Bar (Horizontal/Vertical): Clear bar graphs. Each gauge type also supports different visual “styles” (e.g., Flat, Shadowed, Inset) for further aesthetic refinement.

    Threshold-based Alerts

    You can define low and high thresholds for each sensor metric in the Settings. When a sensor reading crosses these thresholds, the corresponding Sensor Display Widget will visually change (e.g., its border might turn red, its fill color might become critical), and an optional auditory alert can be triggered to draw your attention.

    Robust Data Logging

    All incoming sensor data is timestamped and written to log files in the Sensor_Logs/ directory. The application utilizes a Rotating File Handler to manage log file size, ensuring that logs don’t consume excessive disk space. Old logs are automatically archived or rotated, keeping your system tidy.

    Dynamic Plotting with Matplotlib

    The Matplotlib Widget is a custom PyQt5 widget that embeds a Matplotlib graph. It allows for dynamic updating of sensor data plots. You can interact with the plots, view legends (which are toggleable for individual series), and select different time ranges to analyze trends.

    Persistent Settings Management

    All your preferences – from selected themes and gauge types to alert thresholds and data logging options – are saved to config.ini using config parser. This ensures your customizations persist across application restarts.

    User Interface (UI Preview): A Visual Tour

    Dashboard View

    Sensor Details View

    Plot View

    Settings and Configuration Tabs

    Credits & Licensing

    This application’s initial framework and a significant portion of its core logic were generated by Gemini, a large language model by Google. It has since been meticulously modified, enhanced, and refined by gr4ytips, who has integrated specific Anavi sensor functionalities, implemented advanced UI customizations, and ensured robust data handling.

    Creative License

    This work is licensed under the Creative Commons Attribution 4.0 International (CC BY 4.0) license.

    You are free to:

    • Share — copy and redistribute the material in any medium or format
    • Adapt — remix, transform, and build upon the material for any purpose, even commercially.

    Under the following terms:

    • Attribution — You must give appropriate credit, provide a link to the license, and indicate if changes were made.

    Liability

    This software is provided “as is”, without any warranty—express or implied. Use at your own risk. The authors and contributors shall not be held liable for any claims, damages or other liability, whether in an action of contract, tort or otherwise, arising from, out of or in connection with the software or the use or other dealings in the software.

    Warning

    • Double-check GPIO/I2C wiring to avoid hardware damage.
    • Use a stable power supply.
    • Ensure all software dependencies are installed.
    • Sensor data is raw and uncalibrated.
    • For long-term use, consider backups and watchdogs.

    Disclaimer

    This application is for monitoring only. Not for use in critical or life-sustaining systems.

    What’s Next for the Anavi Sensor Dashboard?

    This application is a living project, with potential for future enhancements based on user feedback and new Anavi hardware. Possible future features could include:

    • Network/Cloud Integration: Sending data to online platforms for remote monitoring and long-term storage.
    • Web Interface: A web-based interface for accessing the dashboard from any device on your local network.
    • More Sensor Support: Expanding compatibility to other Anavi PHAT sensors.
    • Advanced Data Analysis: Implementing more sophisticated data processing and predictive analytics.
    • User Management: For multi-user environments.

    Encourage you to explore the code, customize it further, and contribute to its development! Your feedback and contributions are always welcome.

    Thank you for exploring the Anavi Sensor Dashboard!

  3. Part 4: Enabling JTAG in Firmware and Using It with OpenOCD

    Leave a Comment

    Overview

    Once you’ve discovered your JTAG pins using JTAGenum, you might want to enable them in your own firmware, or use them with a tool like OpenOCD for real debugging. This part shows how to:

    1. Enable JTAG pins explicitly in your firmware (via STM32CubeMX or code)
    2. Maintain those pin functions across reboots
    3. Set up OpenOCD to use your confirmed pinout

    Why Enable JTAG in Firmware?

    On many STM32 boards, including the Black Pill:

    • The default firmware does not enable JTAG.
    • Even if pins are physically accessible, they may be set as GPIO by code.
    • If JTAG is disabled or overridden, tools like JTAGenum or OpenOCD will not connect.

    When is this needed?

    • If you’re writing your own application firmware and want to debug it via JTAG.
    • If you want your board to always be JTAG-accessible for recovery or testing.
    • If you’re building educational tools or lab setups.

    Enabling JTAG Using STM32CubeMX

    The easiest way to enable JTAG at firmware level is to configure it in STM32CubeMX:

    Steps:

    1. Open STM32CubeMX
    2. Load or create a project for STM32F411CE (or your chip)
    3. In the Pinout view:
      • Right-click on pins PA15, PB3, and PB4
      • Set them to SYS_JTDI, SYS_JTDO-SWO, and SYS_JTRST respectively
    4. Go to System Core → SYS in the Configuration panel
    5. Set Debug to Full SWJ (JTAG-DP + SW-DP)
    6. Generate code (HAL-based or LL) and open in STM32CubeIDE or your IDE

    Optional: In the generated main.c, do not change the mode of the configured pins — let the HAL handle it.


    Enabling JTAG Manually in Firmware (Bare Metal)

    If you prefer direct register-level setup:

    // Enable AFIO and remap JTAG
    RCC->APB2ENR |= RCC_APB2ENR_AFIOEN;
    AFIO->MAPR &= ~(AFIO_MAPR_SWJ_CFG);  // Clear bits
    AFIO->MAPR |= 0x00000000;            // Full JTAG enabled
    
    // Set pin modes (e.g., for PA15, PB3, PB4)
    GPIOA->CRH |= (0b1011 << 28); // PA15: AF Push-pull, 50MHz
    GPIOB->CRL |= (0b1011 << 12); // PB3: AF Push-pull, 50MHz
    GPIOB->CRL |= (0b1011 << 16); // PB4: AF Push-pull, 50MHz
    

    This ensures that JTAG pins are not accidentally reconfigured by your own firmware.


    Using OpenOCD with Discovered JTAG Pins

    Now that JTAG is confirmed and enabled, you can use OpenOCD to connect.

    Example: Custom OpenOCD Interface Config (with FTDI or Tigard)

    Create a config file blackpill-jtag.cfg:

    interface ftdi
    ftdi_vid_pid 0x0403 0x6010
    transport select jtag
    
    ftdi_layout_signal nTRST -data 0x01 -noe 0x02
    ftdi_layout_signal TCK   -data 0x04 -noe 0x08
    ftdi_layout_signal TMS   -data 0x10 -noe 0x20
    ftdi_layout_signal TDI   -data 0x40 -noe 0x80
    ftdi_layout_signal TDO   -input 1
    
    adapter_khz 1000
    

    Then run:

    openocd -f blackpill-jtag.cfg -f target/stm32f4x.cfg
    

    If the pin mappings are correct and JTAG is enabled, you should see:

    Info : JTAG tap: stm32f4.cpu tapped
    Info : stm32f4.cpu: hardware has 6 breakpoints, 4 watchpoints
    

    Final Thoughts

    • Discovering pins is just the first step.
    • For persistent and reliable use of JTAG, enable it in firmware and know how to configure your debugger.
    • This empowers you to build resilient workflows for debugging, testing, and even hardware forensics.

    That wraps up Part 4.

Categories

Tags

Archives