Build Your Own Smart Lab with GrovePi+ Sensor Dashboard!
Author: Shafeeque Olassery Kunnikkal | Category: Dexter GrovePi+, GrovePi+, IoT, Raspberry Pi, Seedstudio, Sensor Dashboard | Leave a Comment
Have you ever wanted to connect sensors to your Raspberry Pi to measure things like temperature, light, or even distance? It sounds complicated with all the wires and circuits, right? Well, there’s a fantastic project called the GrovePi+ Sensor Dashboard that makes it super easy and fun!
This project is like a friendly assistant for your Raspberry Pi. It’s a special program that gives you a simple screen (a “dashboard”) where you can see information from different sensors in real-time. You can also control some devices, like turning a light on or off — all from your computer screen!
You can find the project here: https://github.com/gr4ytips/seeedstudio.git
What Does This Dashboard Do?
Imagine having a mini-laboratory at home. This dashboard helps you:
- See Live Data: Watch temperature, humidity, sound, and light levels change in real-time.
- Control Things: Turn a relay (like a smart switch) or buzzer (alarm) on and off with a click.
- Play with Buttons & Lights: Detect button presses and control small LEDs.
- Measure Distance: Use an ultrasonic sensor to measure how far things are.
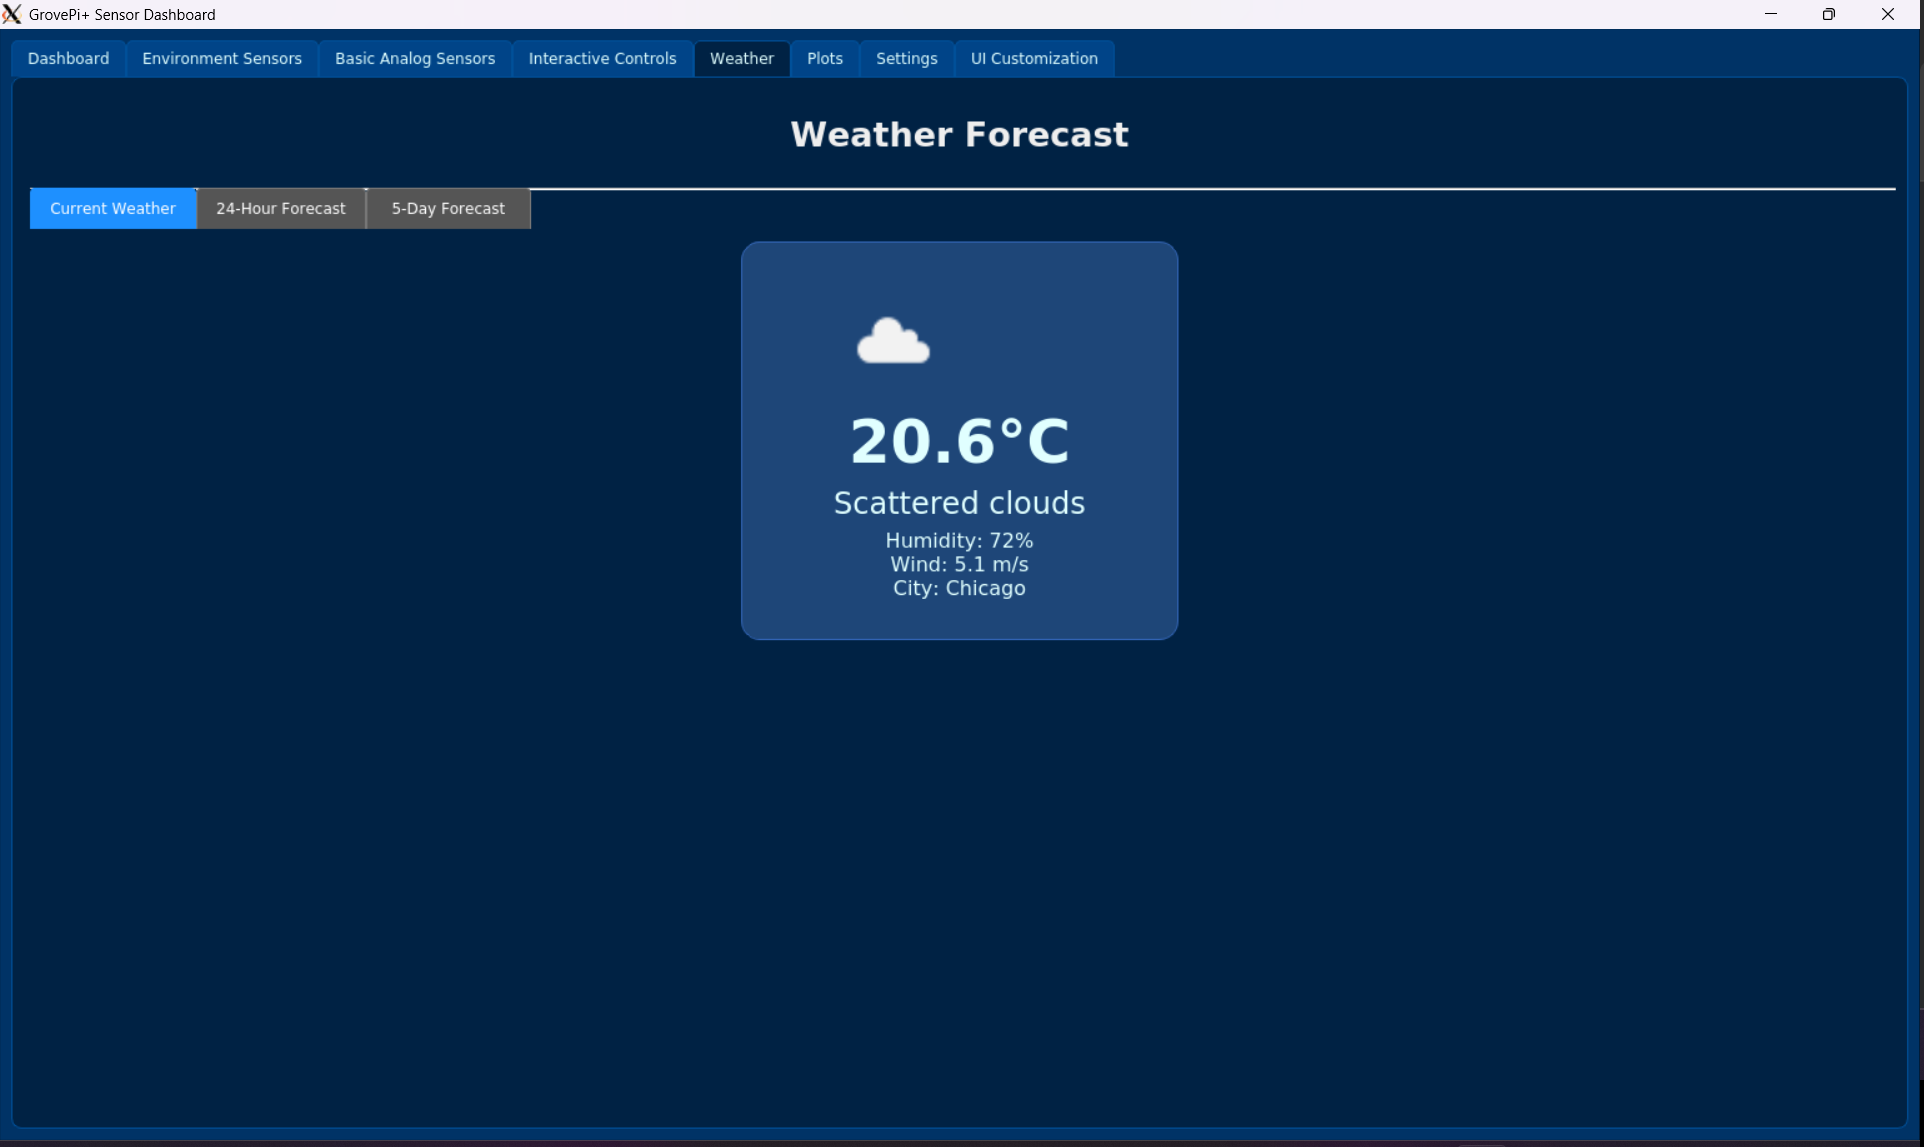
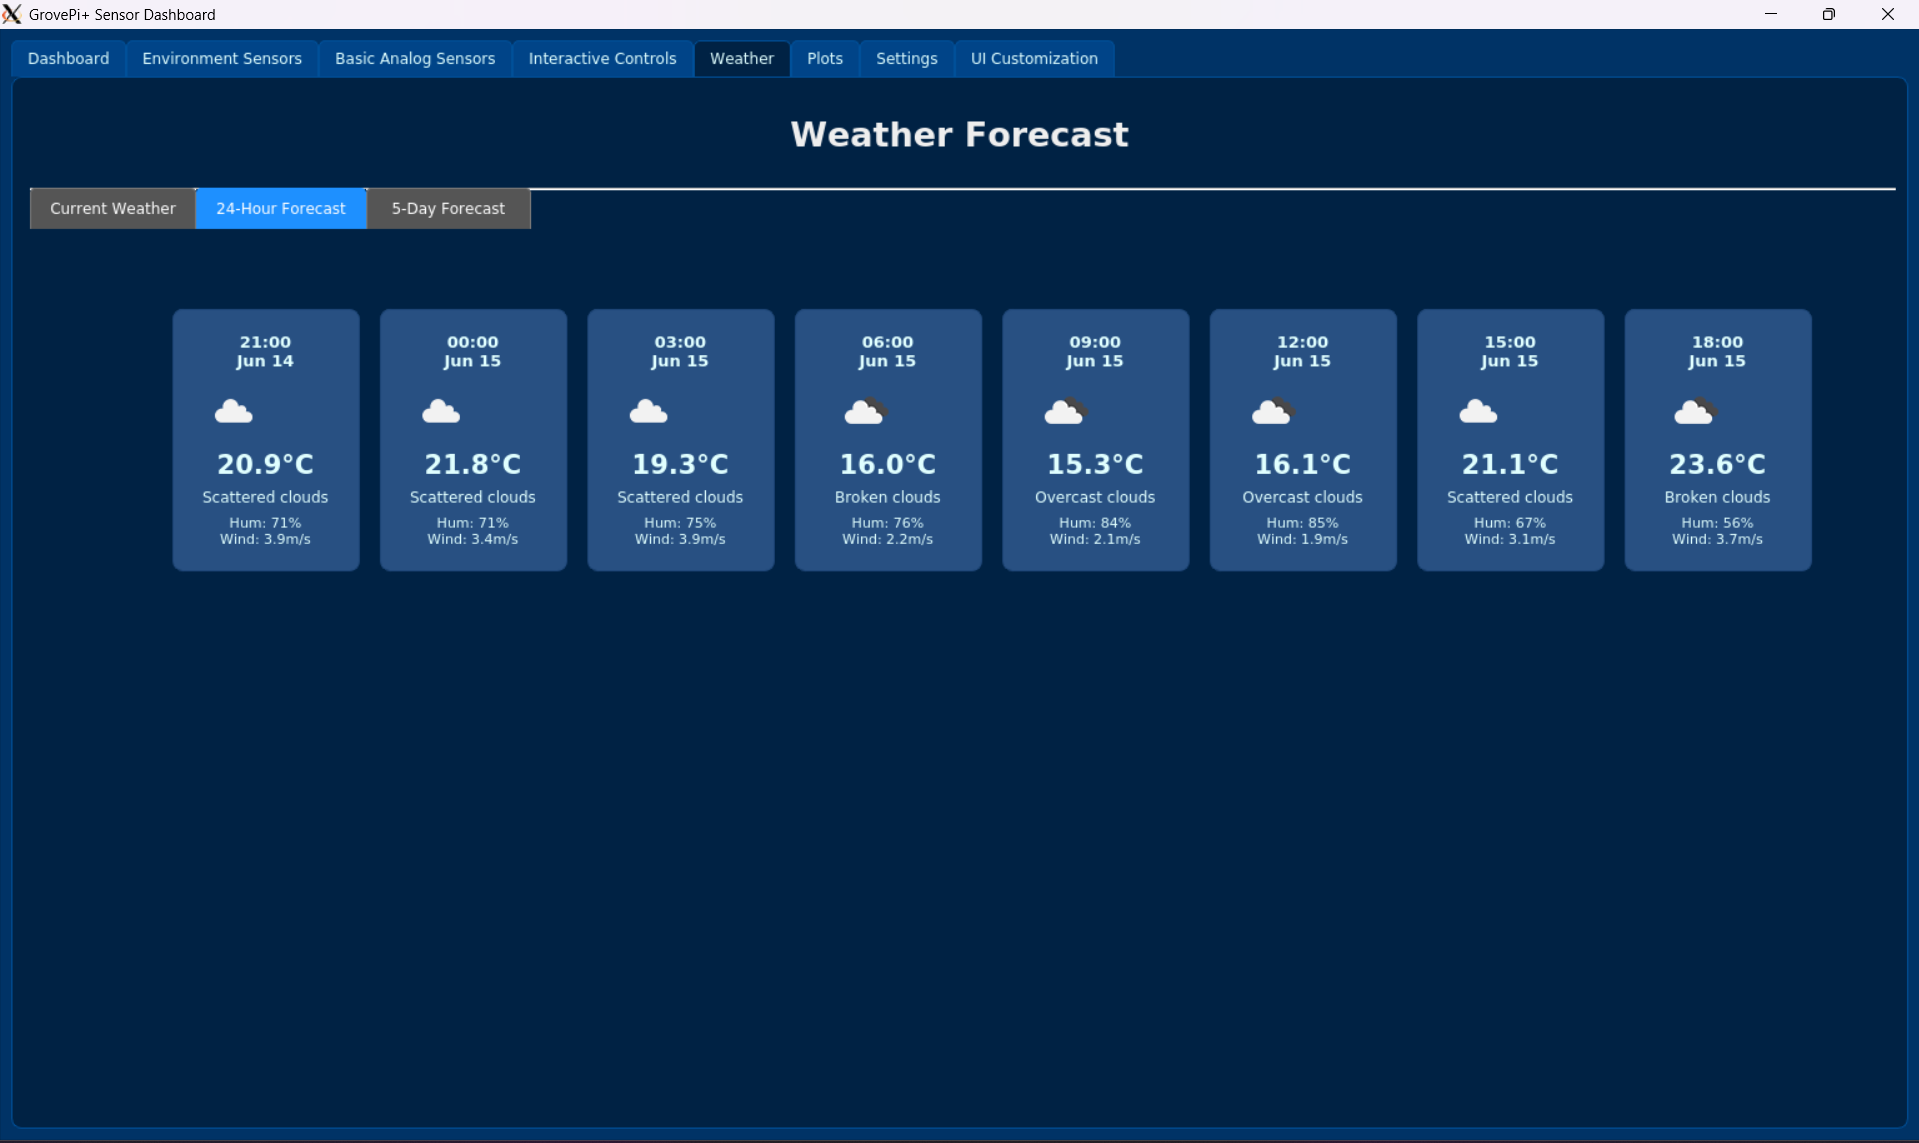
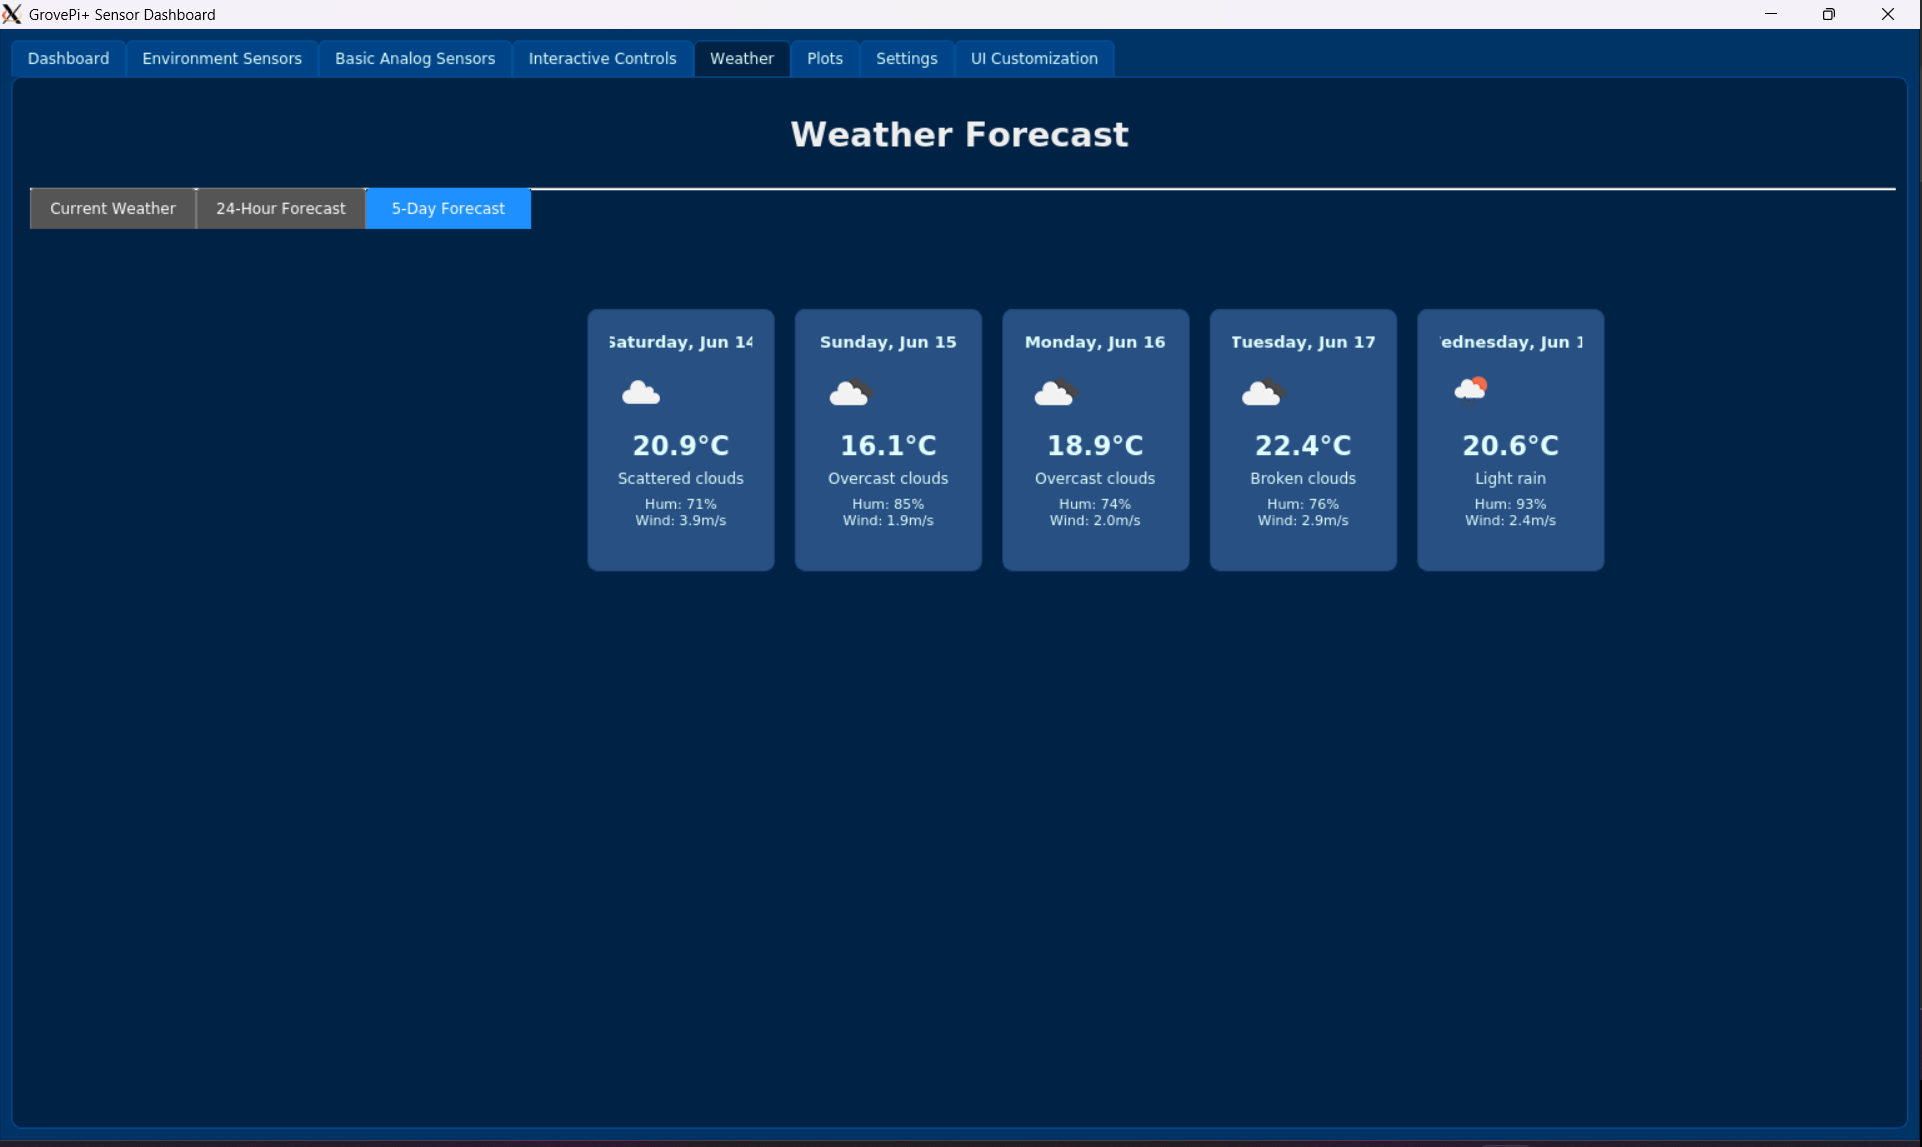
- Check the Weather: Get real-time environmental updates.
It’s all displayed in a clear, easy-to-use window on your Raspberry Pi. This makes it perfect if you’re just starting with electronics, learning about the Internet of Things (IoT), or trying out Python programming.
Why Is It So Easy?
The secret is the GrovePi+ board. It plugs into your Raspberry Pi, and sensors connect with special cables — no messy wiring or soldering. You spend less time troubleshooting and more time building your ideas.
What You Need to Get Started
- Raspberry Pi 3B or 4B
- GrovePi+ board by Seeedstudio
- MicroSD card (with Raspberry Pi OS Buster or Stretch)
- Power supply
- Grove sensors (e.g., DHT11, button, relay, ultrasonic ranger)
- Python 3.5+ installed
How to Get It Running (Quick Look)
Update Your Raspberry Pi
sudo apt-get update && sudo apt-get upgrade
Install GrovePi Library
curl -kL dexterindustries.com/update_grovepi | bash
sudo reboot
Or manual install:
git clone https://github.com/DexterInd/GrovePi.git
cd GrovePi/Software/Python
sudo python3 setup.py install
Clone the Dashboard Repository
git clone https://github.com/gr4ytips/seeedstudio.git
cd seeedstudio/GrovePiPlus
Install Python Dependencies (PyQt5, Pandas, Pyqtgraph)
The dashboard relies on a few key Python libraries to function:
sudo apt-get install python3-pyqt5 (PyQt5): This is the core toolkit that builds the graphical user interface (GUI) of your dashboard. Without PyQt5, the application wouldn’t have its visual windows, buttons, or sensor displays.
pip3 install pandas (Pandas): This powerful library is used for managing and analyzing data. In your dashboard, it helps organize the historical sensor readings, especially for displaying them in clear graphs.
pip3 install pyqtgraph (PyQtGraph): Built on top of PyQt5, PyQtGraph is dedicated to creating dynamic and interactive data plots. It’s what allows the dashboard to show you beautiful graphs of your sensor data over time.
sudo apt-get install python3-pyqt5
sudo pip3 install pandas pyqtgraph
Run the App
python3 main.py
How the Dashboard Works: A Deep Dive into the Code Architecture
The GrovePi+ Sensor Dashboard is built with a well-organized and modular design, using several Python files that work together seamlessly. This structure makes the project robust, easy to understand, and simple to expand.
1. Core Application Orchestration:
main_window.py: This is the central control hub of the entire application.- Initialization: It kicks off essential background services like the
ConfigManager(for settings),Logger(for recording events), andStorageMonitor(for checking disk space). - Tab Management: It’s responsible for setting up the main window’s tabbed interface, creating each of the specific UI tabs (like Dashboard, Weather, Settings, etc.), and adding them to the window.
- Background Processing: Crucially, it starts a separate
SensorWorkerthread. This is vital because reading sensor data can sometimes take time or involve waiting, and putting this work in a separate thread prevents the main application screen from freezing, keeping the user interface smooth and responsive. - Communication Hub: It acts as the primary connector, linking signals (messages) from the
SensorWorker(with new sensor data) and theGrovePiSensorManager(with control feedback) to the right “slots” (update functions) in the various UI tabs, ensuring all displays update in real-time. - System Status & Theming: It also handles periodic checks on system health and manages the application-wide theme, making sure all parts of the UI look consistent with your chosen colors.
- Initialization: It kicks off essential background services like the
2. Hardware Interaction & Sensor Management:
grovepi_sensor_manager.py: This module is your hardware communication expert.- Abstraction: It hides the complex details of talking directly to the GrovePi+ board and its sensors. Instead, other parts of the program can ask it for sensor data or tell it to control devices using simple commands.
- Data Collection: Contains specialized functions to read information from each type of connected Grove sensor, whether they are digital (like a button) or analog (like a light sensor).
- Device Control: Provides methods to send commands to output devices, such as turning a relay on/off or setting the brightness level of an LED bar.
- Mock Mode: A super helpful feature! It has a “mock mode” which simulates sensor readings and device responses without needing the actual physical GrovePi+ board or sensors. This is fantastic for developing and testing the software on any computer.
- Feedback Signals: It sends out notifications (PyQt signals) when a device’s state changes (e.g., when the relay turns on), allowing the dashboard to update its display immediately.
3. User Interface (UI) Modules (The Dashboard Screens):
The application’s interface is divided into several dedicated Python files, each creating a specific PyQt5 QWidget (a screen or “tab”) within the main window. This keeps the interface organized and easy to build upon.
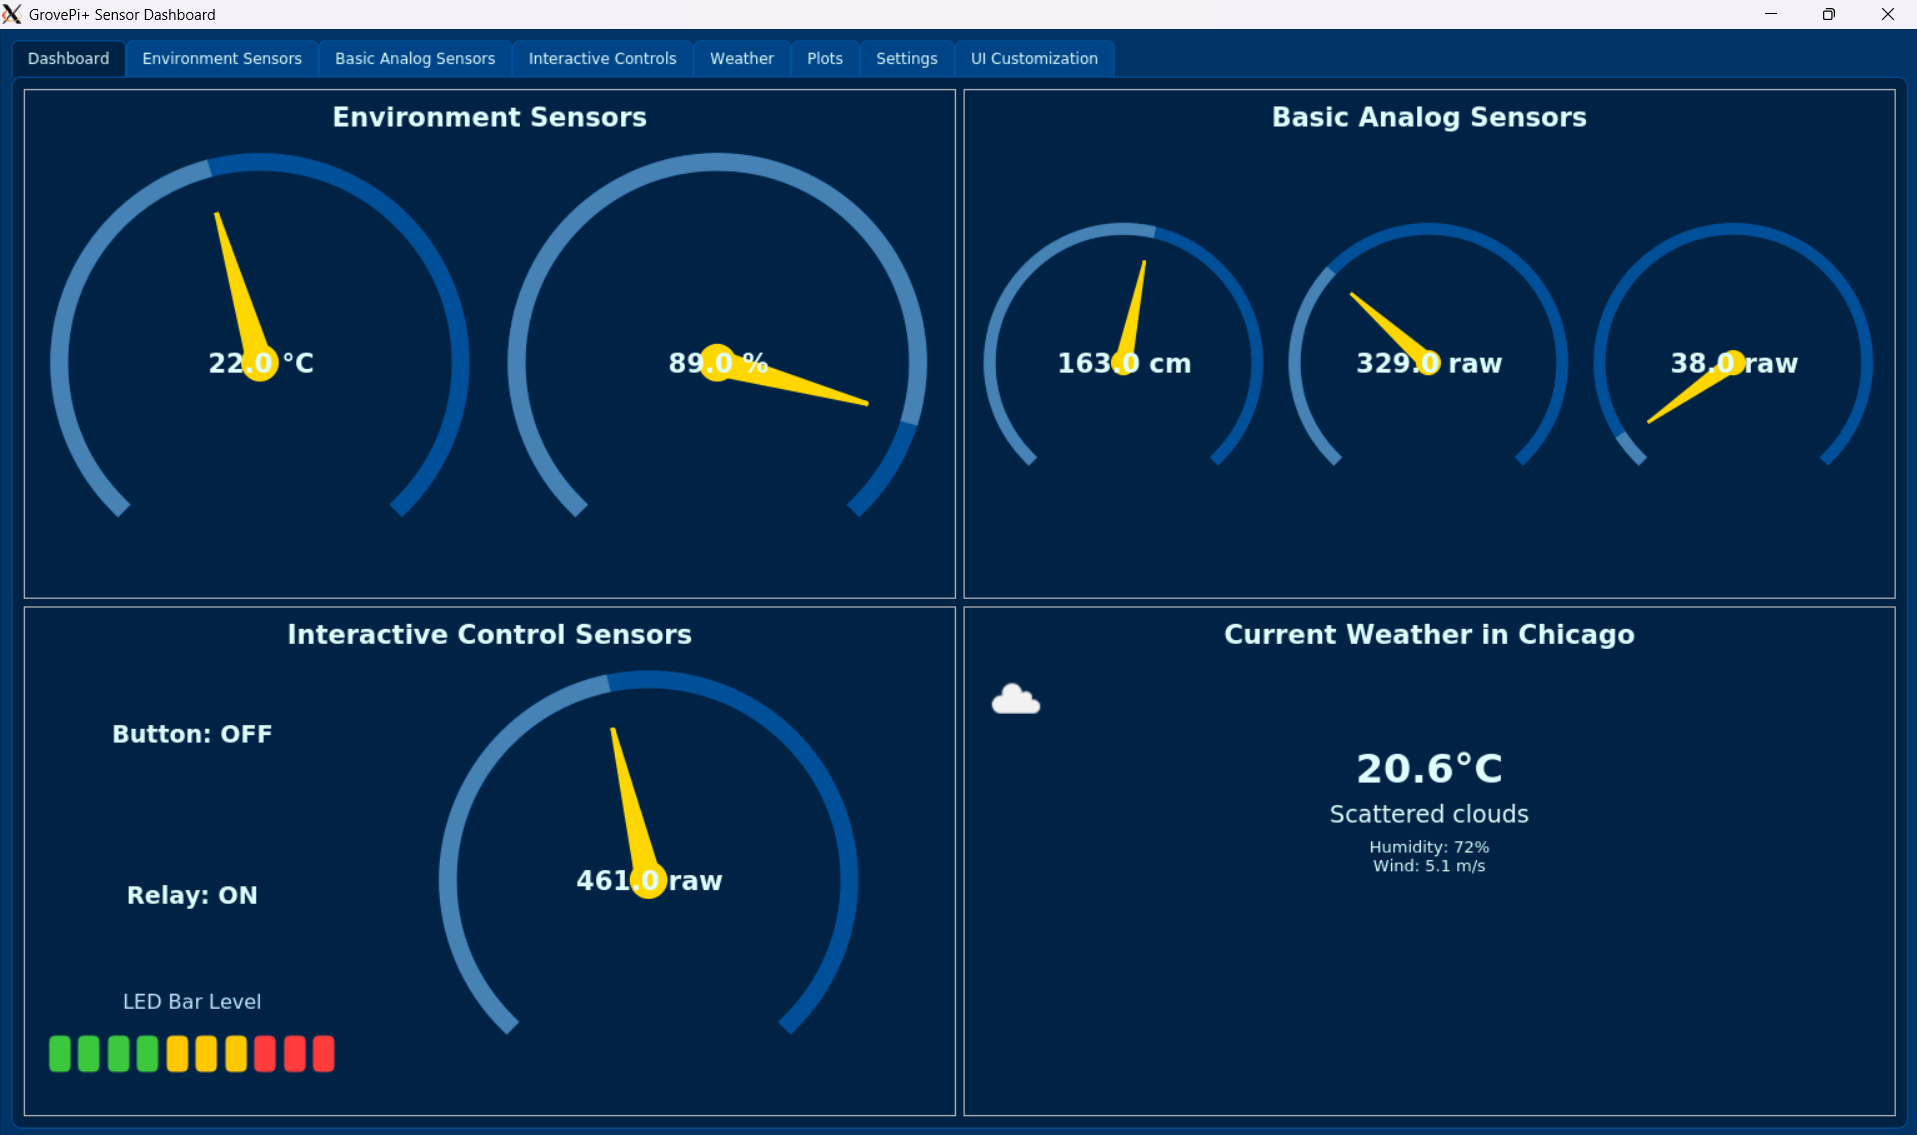
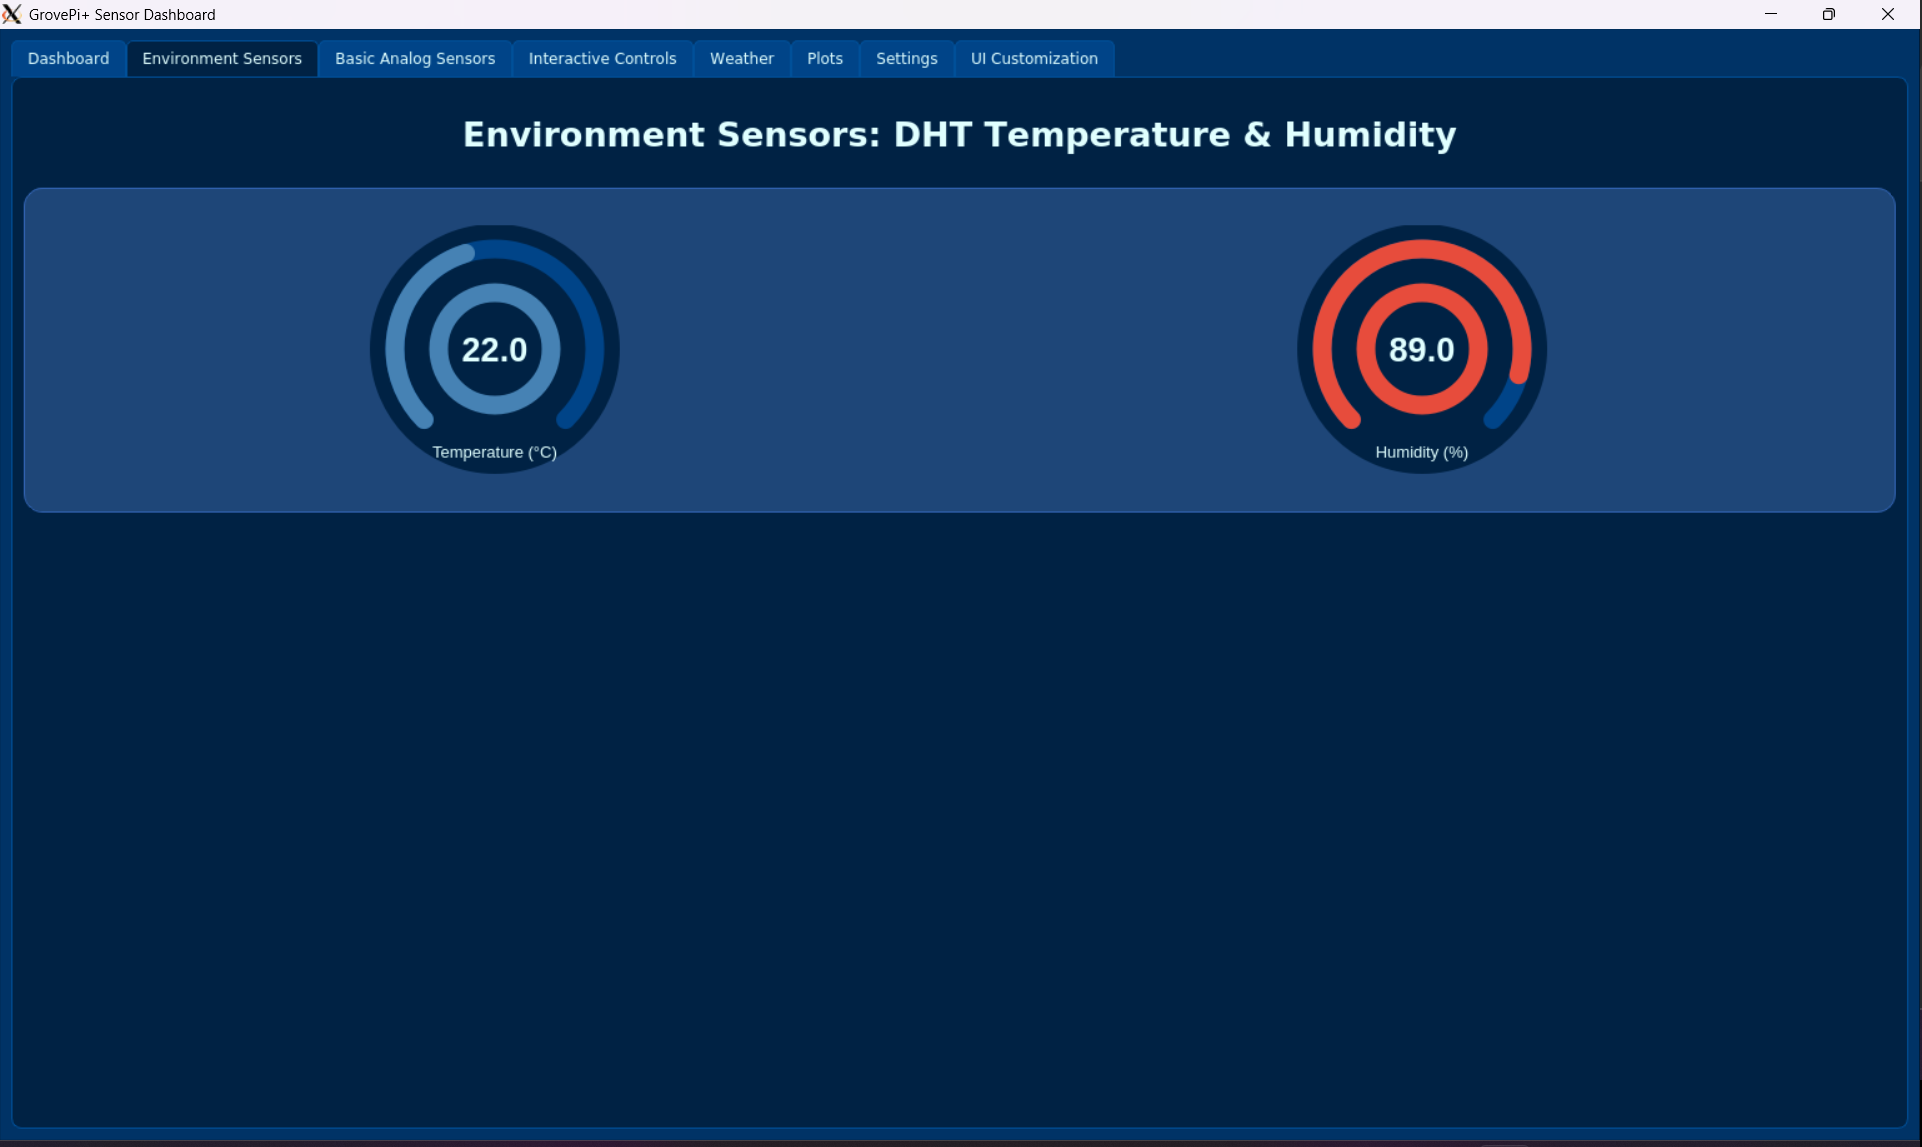
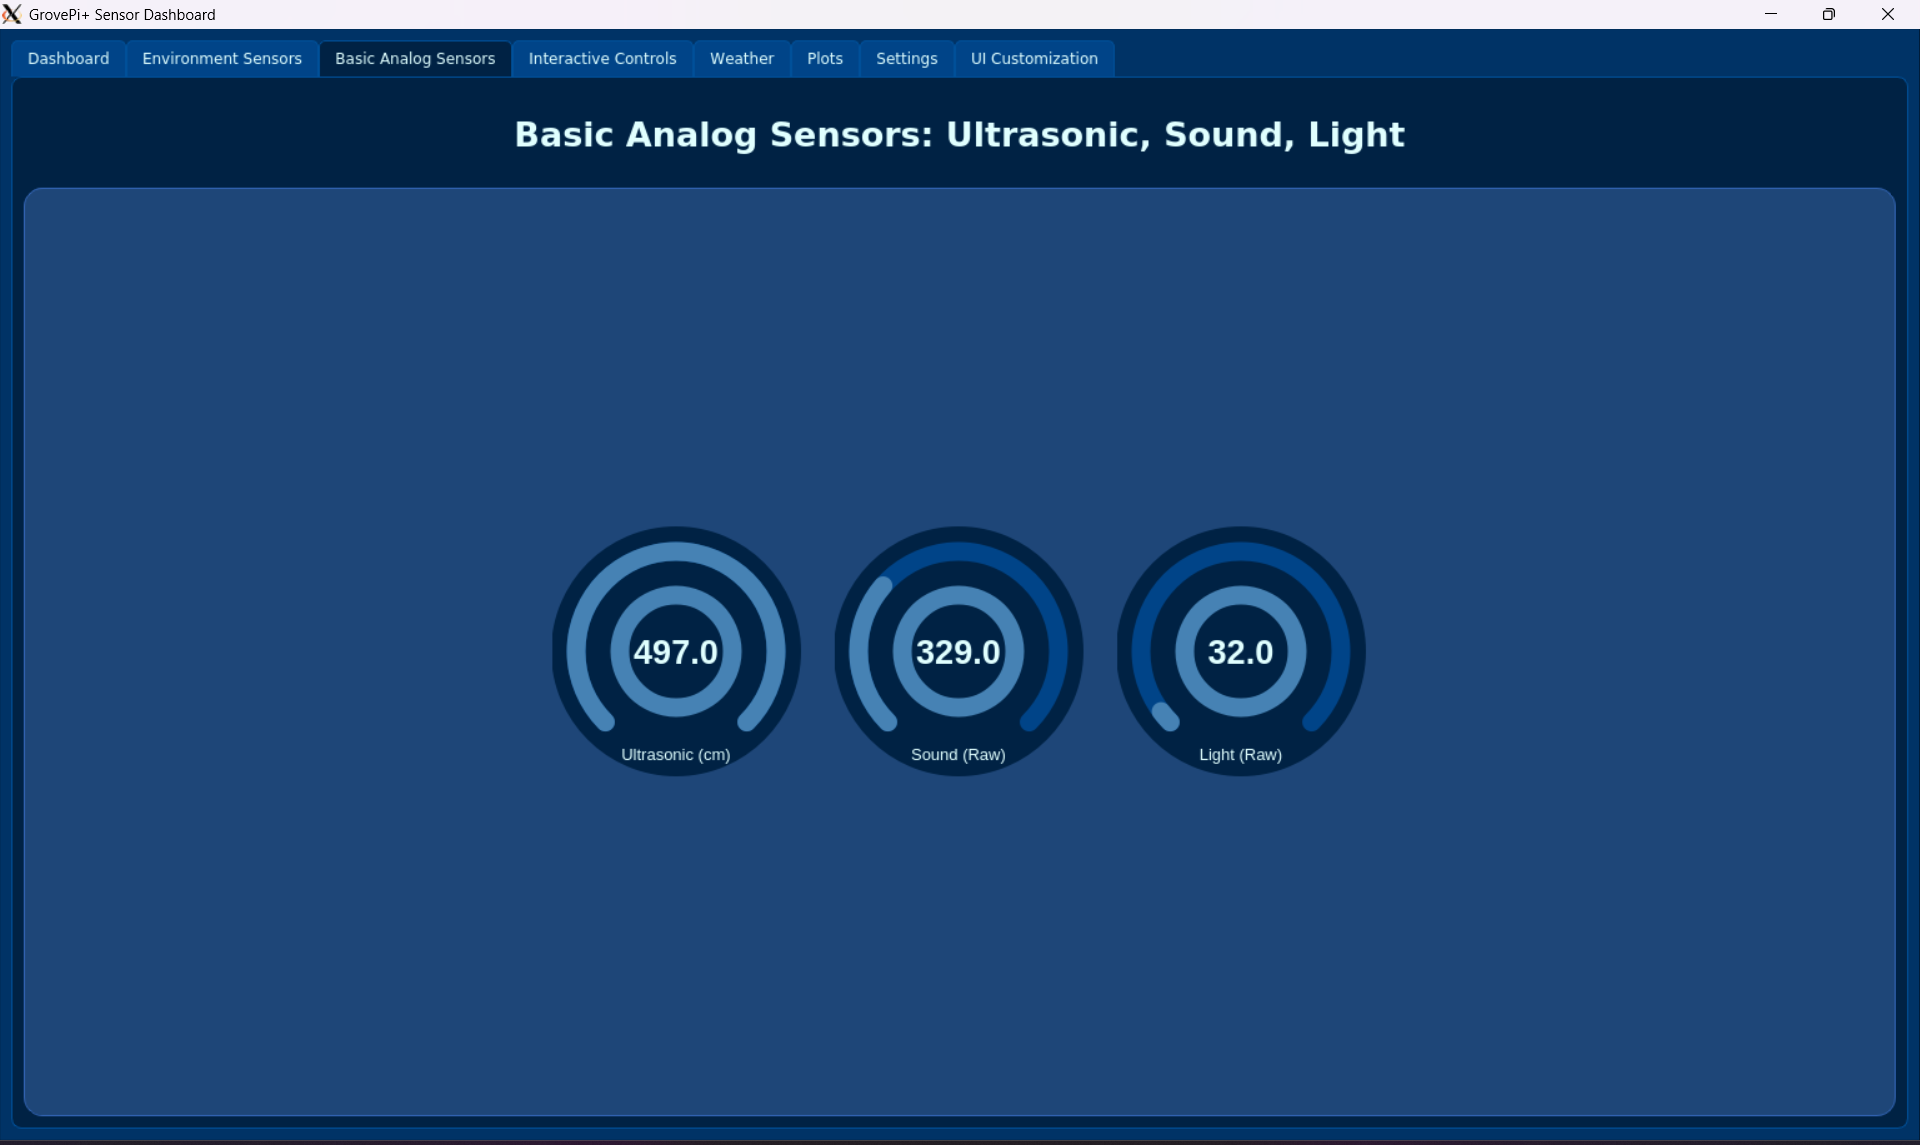
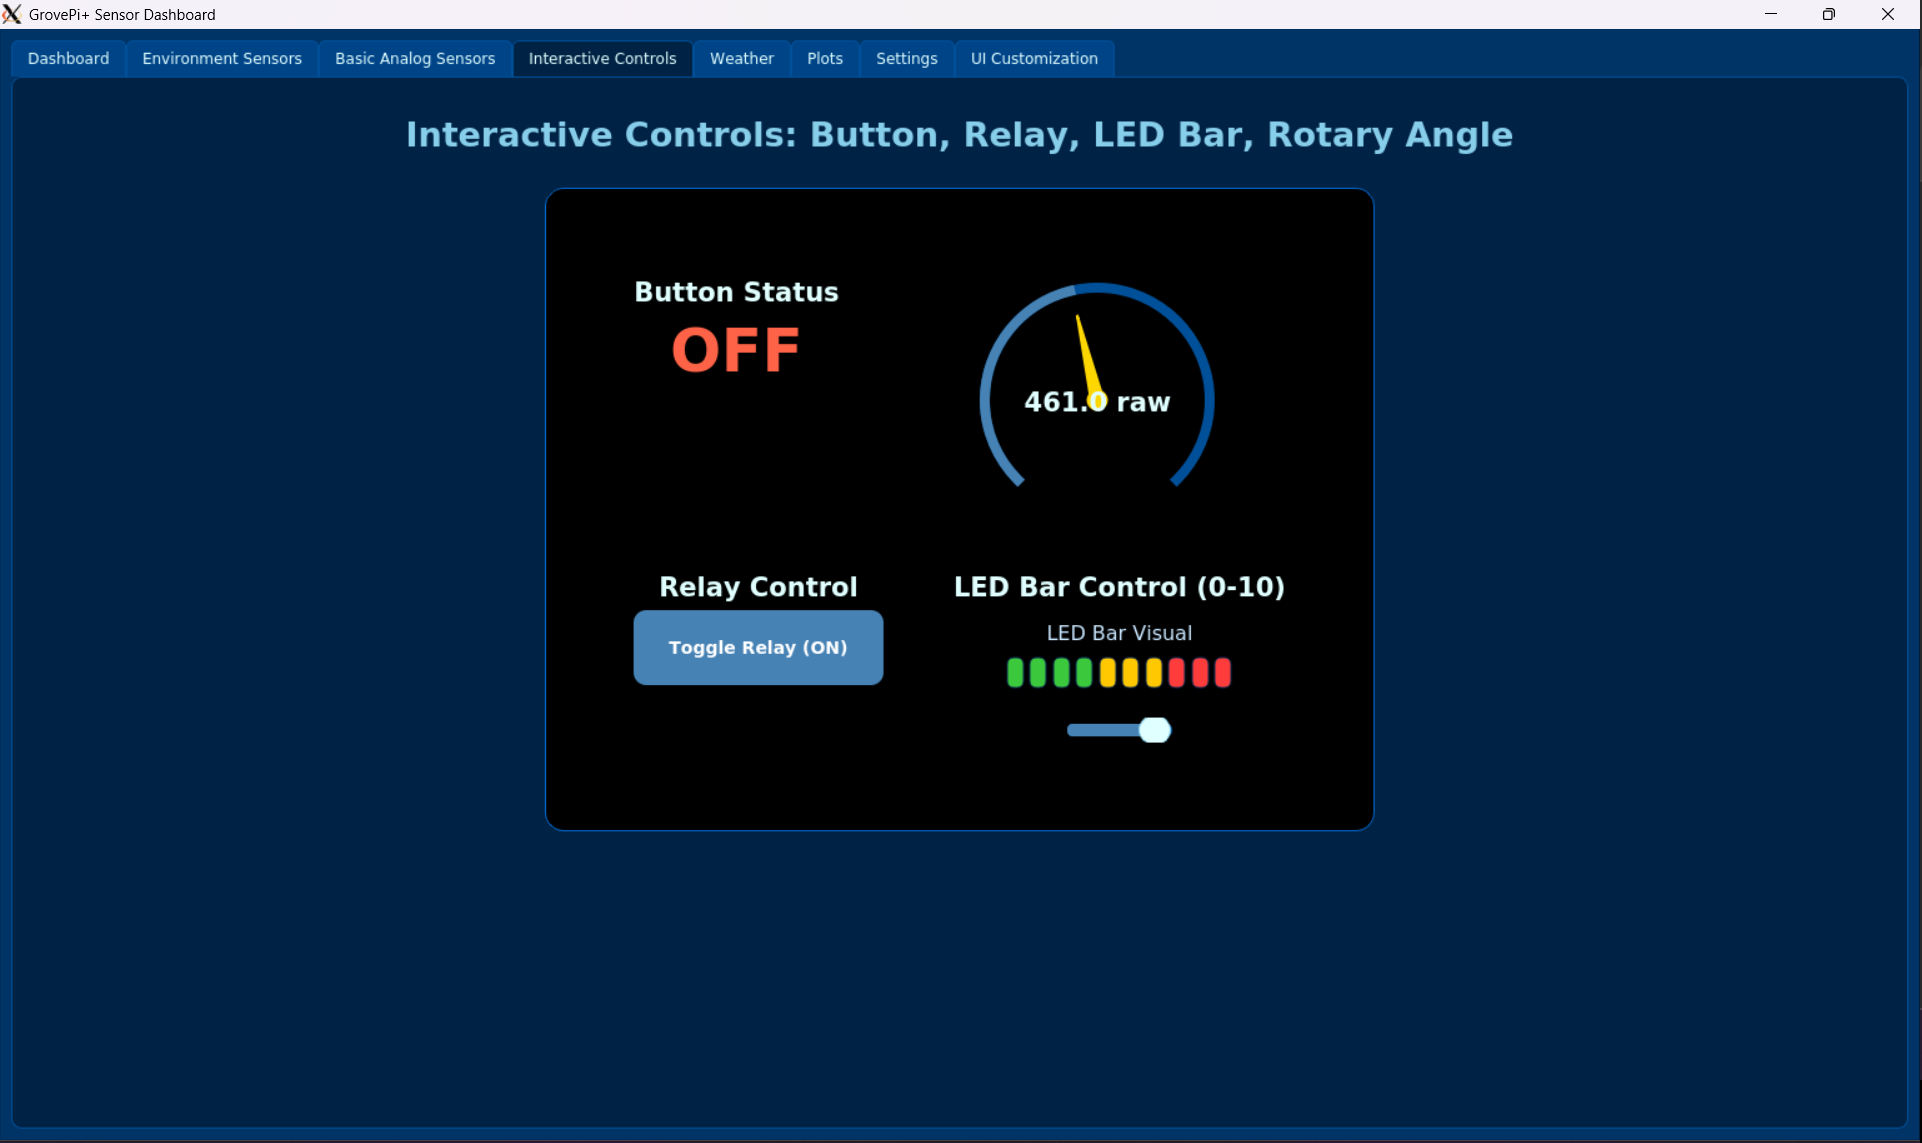
dashboard_tab.py: Your main overview screen. It displays a quick, at-a-glance summary of the most important sensor readings and even integrates current weather information. It uses compact visual gauges to show data clearly.environment_sensors_tab.py: Focuses on environmental readings, providing a more detailed view of temperature and humidity using dedicated gauges.basic_analog_sensors_tab.py: Shows data from your analog sensors, such as values from sound, light, and rotary angle sensors, often using different visual styles for their displays.interactive_control_sensors_tab.py: This is where you actively control and interact with devices. You can see the status of buttons, toggle relays, control the LED bar’s brightness, and monitor the rotary angle sensor.plots_tab.py: The data analysis center. This tab lets you see historical sensor data in interactive graphs using powerfulpandasandpyqtgraphlibraries. You can select which sensors to plot and choose different time periods to see trends, and even export the graphs!settings_tab.py: Your dashboard’s control panel. Here, you can customize how the application works. This includes enabling/disabling logging, setting up where data and logs are saved, entering your OpenWeatherMap API key for weather data, and even switching between mock (simulated) or live (real) sensor modes. It also shows you the available storage space on your Raspberry Pi.ui_customization_tab.py: Allows you to personalize the look and feel of your dashboard. You can choose from different color themes to match your preference.
4. Custom UI Widgets (The “Mini-Artists”):
These modules define specialized, visually appealing PyQt5 QWidgets that draw unique components like gauges and LED bars, making the data more engaging.
gauge_widget.py,gui_widgetsone.py,gui_widgets_multiring.py: These files contain the code for drawing various circular gauge displays. They take raw sensor numbers and visually represent them with needles, arcs, and colors. Some can even change color (e.g., to orange or red) if a sensor reading goes into a “warning” or “critical” range.led_bar_widget.py: This creates a custom visual LED bar on the screen, showing how many of its 10 segments are lit based on a numerical value. The colors of the lit segments (green, yellow, red) provide an immediate visual cue of the level.dashboard_gauge_widget.py: A compact gauge designed specifically for the dashboard overview. It’s smaller but still effectively displays sensor values with a circular progress indicator and color-coded alerts.
5. Utility Modules (Behind-the-Scenes Helpers):
These are crucial support modules that handle common tasks across the application.
config_manager.py: The memory of the application. This clever module ensures that all your settings (like your chosen theme, API keys, or log folders) are saved to a file (app_config.json) and remembered the next time you open the dashboard. It uses a “singleton” pattern, meaning there’s only ever one copy of your settings available to the whole program, preventing confusion.logger.py: The application’s diary. This module records important messages, warnings, and errors as the program runs, both to your computer screen and to special log files. This is incredibly helpful for figuring out what went wrong if something unexpected happens. It also manages log file sizes, so they don’t fill up your disk.storage_monitor.py: Your disk space checker. This utility helps the dashboard keep an eye on how much free space is left on your Raspberry Pi. It’s especially useful for making sure there’s enough room for all the sensor data and log files.weather_api.py: The weather reporter. This module connects to an online weather service (OpenWeatherMap) to fetch live weather information for your chosen location, displaying it directly on your dashboard. It smartly gets your API key and city details from theconfig_manager.
All these components, from the central window to the smallest utility, work in harmony. This makes the GrovePi+ Sensor Dashboard a powerful, extensible, and user-friendly solution for all your Raspberry Pi sensor projects!
See It in Action!
Dashboard Overview
Environment Sensors Tab
Analog Sensors Tab
Interactive Sensors Tab
Weather Tabs
Important Safety Note
This project is for educational and prototyping use. Always handle electronics with care, especially when using powered modules like relays. Use responsibly and follow safety instructions.
Credits and Liability Disclaimer
This code for the GrovePi+ Sensor Dashboard has been generated using Gemini, an AI large language model, with direct input and feedback from gr4ytips.
The information, software, and associated documentation are provided “as is” without warranty of any kind, either express or implied, including, but not limited to, the implied warranties of merchantability and fitness for a particular purpose. In no event shall the authors or copyright holders be liable for any claim, damages, or other liability, whether in an action of contract, tort, or otherwise, arising from, out of, or in connection with the software or the use or other dealings in the software.
License
This work is licensed under a Creative Commons Attribution-NonCommercial 4.0 International License.
Start building your own smart Raspberry Pi lab today with GrovePi+ Sensor Dashboard — and bring your ideas to life!